. 2011 Aug 4;118(5):1264-73.
doi: 10.1182/blood-2011-01-328567. Epub 2011 Jun 7.

Crosstalk between NOTCH and AKT signaling during murine megakaryocyte lineage specification

Affiliations

Crosstalk between NOTCH and AKT signaling during murine megakaryocyte lineage specification

Melanie G Cornejo et al. Blood. .

Abstract

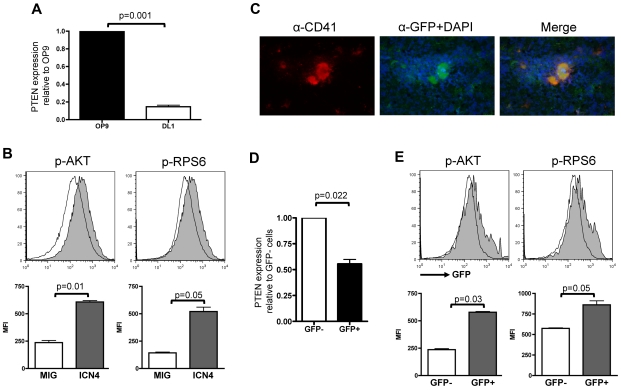
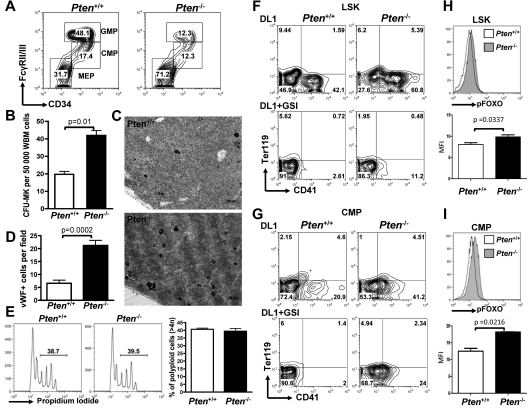
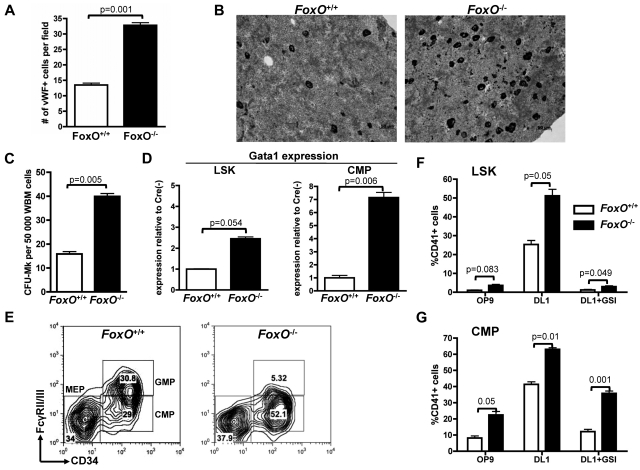
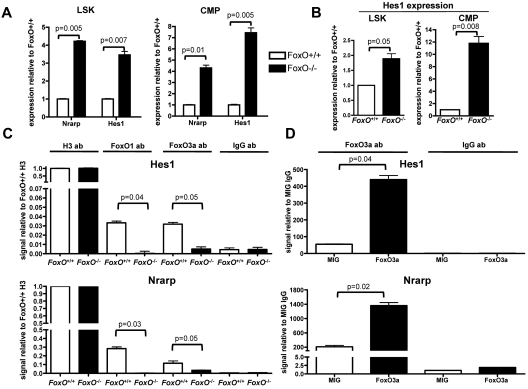
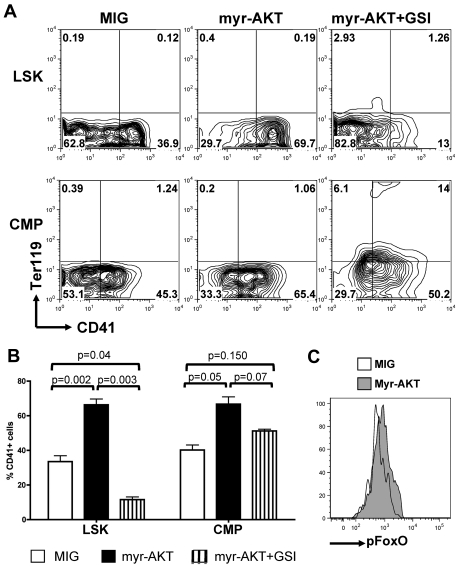
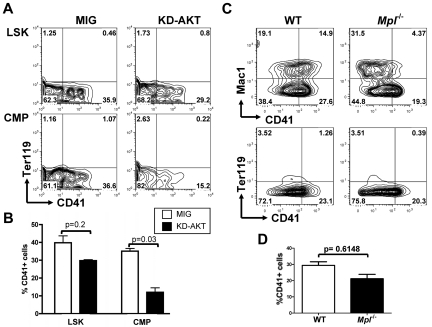
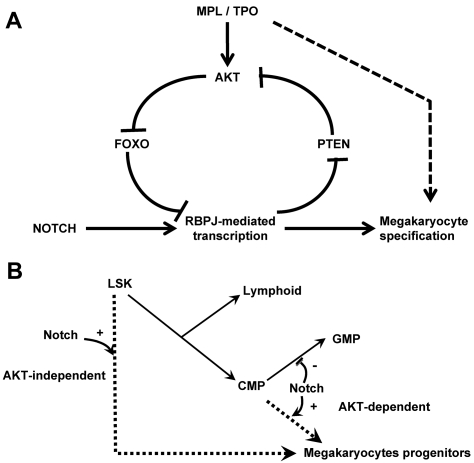
The NOTCH signaling pathway is implicated in a broad range of developmental processes, including cell fate decisions. However, the molecular basis for its role at the different steps of stem cell lineage commitment is unclear. We recently identified the NOTCH signaling pathway as a positive regulator of megakaryocyte lineage specification during hematopoiesis, but the developmental pathways that allow hematopoietic stem cell differentiation into the erythro-megakaryocytic lineages remain controversial. Here, we investigated the role of downstream mediators of NOTCH during megakaryopoiesis and report crosstalk between the NOTCH and PI3K/AKT pathways. We demonstrate the inhibitory role of phosphatase with tensin homolog and Forkhead Box class O factors on megakaryopoiesis in vivo. Finally, our data annotate developmental mechanisms in the hematopoietic system that enable a decision to be made either at the hematopoietic stem cell or the committed progenitor level to commit to the megakaryocyte lineage, supporting the existence of 2 distinct developmental pathways.


Figures

Figure 1
Figure 1
NOTCH activation correlates with Pten down-regulation and increased activation of PI3K/AKT pathway. (A) RNA from sorted wild-type LSK cells cocultured with OP9-GFP or OP9-DL1 for 3 days was used to perform analysis of Pten expression normalized to Gapdh and are shown relative to LSK cells grown on OP9-GFP. Mean ± SEM of triplicate experiments is represented. (B) Flow-sorted Lineage cells infected with either MSCV-IRES-GFP or MIG-ICN4 were fixed/permeabilized and prepared for phospho-flow analyses. Histograms show a representative of 3 independent animals from each group, and bar graphs indicate mean ± SEM. (C) Immunofluorescence on fresh frozen TNR BM sections probed with an anti-CD41 and an anti-GFP Ab and counterstained with DAPI shows that megakaryocytes are GFP+. (D) RNA was extracted from flow-sorted LineagecKit+GFP and LineagecKit+GFP+ cells of TNR animals, and quantitative RT-PCR analysis for PTEN expression was performed. Mean ± SEM of duplicate analysis is shown. (E) Flow-sorted Lineage cKit+ cells from TNR animals were fixed/permeabilized and stained for phospho-AKT or phospho-RPS6. Phosphorylation levels in GFP+ (active NOTCH signaling) and GFP (inactive NOTCH signaling) cells were assessed by flow cytometry. Histograms show a representative of 6 independent animals tested, and bar graphs indicate mean ± SEM.
Figure 2
Figure 2
Pten deficiency enhances megakaryopoiesis in vivo and differentially affects NOTCH-induced megakaryopoiesis from LSK versus CMP cells. (A) Flow cytometric analysis of myeloid progenitors within the LineagecKit+Sca1 population of PtenFlox/Flox-Mx1Cre (Pten+/+) or PtenFlox/Flox-Mx1Cre+ (Pten−/−) animals 2 weeks after pIpC. A representative of 5 independent animals is shown for each group. (B) Whole BM cells from Pten+/+ and Pten−/− mice were plated in MegaCult for assessment of CFU-MK potential. Mean ± SEM of quadruplicate experiments is represented. (C) Immunohistochemical analysis for the VWF highlights megakaryocytes (black). (D) Bar graphs are a representation of the analysis performed in panel C. The mean ± SEM number of megakaryocytes per microscope field in 25 independent fields is shown. (E) Megakaryocytes from Pten+/+ and Pten−/− mice were analyzed for ploidy content with the use of propidium iodide. Left and middle panels: a representative analysis is shown. Percentages of polyploid cells (> 4n) are indicated. Right panel: Bar graphs are representation of 4 independent analyses. (F) LSK cells from Pten+/+ and Pten−/− mice were flow-sorted 2 weeks after pIpC treatment and were cultured on OP9-DL1 stroma in the presence or absence of 1μM GSI. After 6 days of cocultures, cells were analyzed by flow cytometry for the development of CD41+ cells within the CD45+ gate. (G) CMP cells from Pten+/+ and Pten−/− mice were flow-sorted 2 weeks after pIpC treatment and analyzed as in panel F. (H) LSK cells from Pten+/+ and Pten−/− were cultured on OP9-DL1 stroma for 4 days and analyzed for phospho-FOXO by flow cytometry. Top panel: a representative analysis gated on CD45+ hematopoietic cells is shown. Bottom panel: bar graphs indicate the mean ± SEM of 2 independent experiments. (I) CMP cells from Pten+/+ and Pten−/− were analyzed as in panel H.
Figure 3
Figure 3
Absence of FOXO factors increases megakaryocytic potential of LSK cells and CMPs in vivo. (A) Immunohistochemical analysis of BM sections was performed against the VWF to highlight the megakaryocytes in FoxO1/3/4Flox/Flox-Mx1Cre (FoxO+/+) versus FoxO1/3/4Flox/Flox-Mx1Cre+ (FoxO−/−) animals. Bar graphs represent the mean ± SEM number of megakaryocytes per microscope field in 25 independent fields. (B) Representative images of analysis performed in panel A. Megakaryocytes are in black. (C) Whole BM cells from FoxO+/+ or FoxO−/− animals were plated in MegaCult for assessment of CFU-MK potential. Mean ± SEM of quadruplicate experiments is represented. (D) Quantitative expression analysis of Gata-1 in flow-sorted LSK cells and CMPs from FoxO−/− or FoxO+/+ animals. All signals were normalized to Gapdh and are shown relative to FoxO+/+ RNA. Bar graphs represent the mean ± SEM of triplicate experiments. (E) Flow cytometric analysis of myeloid progenitors within the LineagecKit+Sca1 population of FoxO+/+ or FoxO−/− animals 3 weeks after pIpC. A representative analysis is shown. (F) LSK cells from FoxO+/+ or FoxO−/− mice were flow-sorted 3 weeks after pIpC treatment and cultured on OP9-GFP or OP9-DL1 stroma in the presence or absence of 1μM GSI. After 6 days of coculture, cells were analyzed by flow cytometry for the development of CD41+ cells within the CD45+ gate. Bar graphs indicate the mean ± SEM of 4 independent experiments. (G) CMP cells from FoxO+/+ or FoxO−/− mice were purified and analyzed as in panel F. Bar graphs indicate the mean ± SEM of 4 independent experiments.
Figure 4
Figure 4
FOXO proteins bind to the Hes1 promoter region and antagonize NOTCH target genes transcription. (A) Quantitative RT-PCR analysis of Nrarp and Hes1 in flow-sorted LSK cells and CMPs from FoxO−/− or FoxO+/+ animals. All signals were normalized to Gapdh and are shown relative to FoxO+/+ RNA. Bar graphs represent the mean ± SEM of triplicate experiments. (B) RNAs from flow-sorted FoxO−/− or FoxO+/+ LSK cells and CMPs were extracted after 3 days of coculture with OP9-DL1 stroma and analyzed by quantitative RT-PCR as in panel A. Bar graphs represent the mean ± SEM expression normalized to Gapdh and shown relative to FoxO+/+ cells grown on OP9-DL1 (n = 3). (C) ChIP of FoxO+/+ or FoxO−/− Lin cells with the use of an anti-FOXO1 or an anti-FOXO3a Ab. Anti-Histone H3 and anti-IgG Abs were used as positive and negative controls, respectively. Bar graphs represent the mean ± SEM of triplicate experiments, and all Hes1 or Nrarp promoter region signals are normalized to FoxO+/+ sample pulled down with anti-Histone H3 Ab. (D) ChIP analysis of Lin cells infected with an empty MIG vector or with a wild-type FoxO3a construct and pulled down with an anti-FOXO3a Ab. All signals are normalized to MIG cells pulled down with an anti-IgG Ab, and bar graphs represent the mean ± SEM of triplicate experiments.
Figure 5
Figure 5
Constitutive activation of AKT synergizes with NOTCH during in vitro megakaryopoiesis. (A) Sorted wild-type LSK cells and CMPs were transduced with retroviruses encoding either MIG or myr-AKT and subsequently plated on OP9-DL1 stroma in the presence or absence of GSI. Contour plots show a representative of 5 independent experiments. (B) Bar graphs represent mean ± SEM from 5 independent experiments described in panel A. (C) Wild-type CMPs were infected with an empty control (MIG) or myr-AKT vector, plated on OP9-DL1 stroma for 4 days, and analyzed for phospho-FOXO by flow cytometry. A representative analysis gated on CD45+ hematopoietic cells is shown.
Figure 6
Figure 6
AKT activity is important for NOTCH-induced megakaryopoiesis from CMPs but not from LSK cells. (A) Flow cytometric analysis of purified wild-type LSK cells or CMPs infected with an empty control vector (MIG) or an inactive KD-AKT allele and plated on OP9-DL1 stroma for 6 days. Contour plots obtained from FACS analysis show a representative of 4 independent experiments. (B) Bar graphs represent mean ± SEM from 4 independent experiments described in panel A. (C) LSK cells from Mpl−/− and wild-type control animals were flow-sorted and cocultured with OP9-DL1 stroma for 6 days. A representative analysis, gated on CD45+ hematopoietic cells, is shown. (D) Bar graphs represent mean ± SEM from 2 independent experiments described in panel C.
Figure 7
Figure 7
Schematic representation of the crosstalk between the NOTCH and AKT pathways at the molecular and cellular levels. (A) Scheme of the molecular pathways. NOTCH pathway activation inhibits PTEN expression leading to AKT activation, FOXO phosphorylation, and enhanced RBPJ-mediated transcription. We hypothesize that this regulatory loop links cytokine receptor signaling and RBPJ-mediated transcription. (B) Scheme of the megakaryocyte lineage development pathways. Our results support the hypothesis that megakaryocyte can develop from immature hematopoietic cells through a NOTCH-induced AKT-independent pathway. Megakaryocyte can also develop from committed myeloid progenitor through an AKT-dependent pathway that is activated by cytokine receptor activation (eg, MPL) and may also be stimulated by the NOTCH signaling.

References

    1. Luc S, Buza-Vidas N, Jacobsen SE. Delineating the cellular pathways of hematopoietic lineage commitment. Semin Immunol. 2008;20(4):213–220. - PubMed
    1. Weissman IL, Shizuru JA. The origins of the identification and isolation of hematopoietic stem cells, and their capability to induce donor-specific transplantation tolerance and treat autoimmune diseases. Blood. 2008;112(9):3543–3553. - PMC - PubMed
    1. Luc S, Anderson K, Kharazi S, et al. Down-regulation of Mpl marks the transition to lymphoid-primed multipotent progenitors with gradual loss of granulocyte-monocyte potential. Blood. 2008;111(7):3424–3434. - PubMed
    1. Pronk CJ, Rossi DJ, Mansson R, et al. Elucidation of the phenotypic, functional, and molecular topography of a myeloerythroid progenitor cell hierarchy. Cell Stem Cell. 2007;1(4):428–442. - PubMed
    1. Forsberg EC, Serwold T, Kogan S, Weissman IL, Passegue E. New evidence supporting megakaryocyte-erythrocyte potential of flk2/flt3+ multipotent hematopoietic progenitors. Cell. 2006;126(2):415–426. - PubMed

Publication types

MeSH terms