. 2011 Jul 29;286(30):26406-17.
doi: 10.1074/jbc.M110.191239. Epub 2011 Jun 8.

Cellular inhibitor of apoptosis protein-1 (cIAP1) can regulate E2F1 transcription factor-mediated control of cyclin transcription

Affiliations

Cellular inhibitor of apoptosis protein-1 (cIAP1) can regulate E2F1 transcription factor-mediated control of cyclin transcription

Jessy Cartier et al. J Biol Chem. .

Abstract

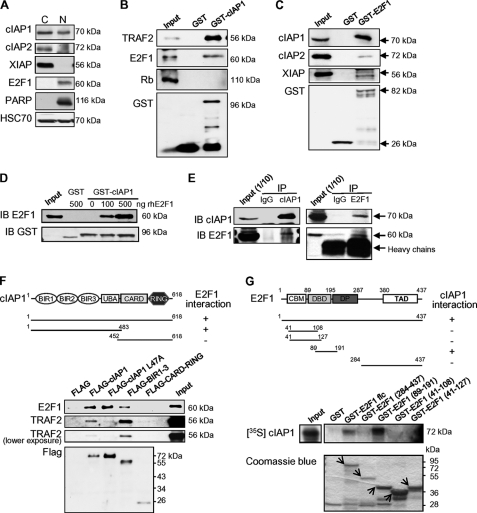
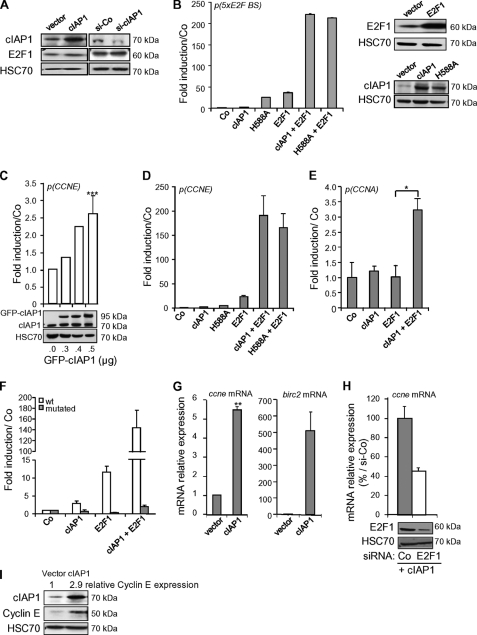
The inhibitor of apoptosis protein cIAP1 (cellular inhibitor of apoptosis protein-1) is a potent regulator of the tumor necrosis factor (TNF) receptor family and NF-κB signaling pathways in the cytoplasm. However, in some primary cells and tumor cell lines, cIAP1 is expressed in the nucleus, and its nuclear function remains poorly understood. Here, we show that the N-terminal part of cIAP1 directly interacts with the DNA binding domain of the E2F1 transcription factor. cIAP1 dramatically increases the transcriptional activity of E2F1 on synthetic and CCNE promoters. This function is not conserved for cIAP2 and XIAP, which are cytoplasmic proteins. Chromatin immunoprecipitation experiments demonstrate that cIAP1 is recruited on E2F binding sites of the CCNE and CCNA promoters in a cell cycle- and differentiation-dependent manner. cIAP1 silencing inhibits E2F1 DNA binding and E2F1-mediated transcriptional activation of the CCNE gene. In cells that express a nuclear cIAP1 such as HeLa, THP1 cells and primary human mammary epithelial cells, down-regulation of cIAP1 inhibits cyclin E and A expression and cell proliferation. We conclude that one of the functions of cIAP1 when localized in the nucleus is to regulate E2F1 transcriptional activity.


Figures

FIGURE 1.
FIGURE 1.
cIAP1 interacts with the transcription factor E2F1. A, immunoblot analysis of cIAP1, cIAP2, XIAP, and E2F1 in cytoplasm (C) and nuclear (N)-enriched fractions. PARP is used to check the nuclear fraction. HSC70: loading control. B–D, GST pull-down analysis of the interaction of GST-cIAP1 (B, D) or GST-E2F1 (C) with indicated proteins from HeLa cell lysate (B, C) or with purified human E2F1 (D). E, endogenous E2F1 (right panel) or cIAP1 (left panel) were immunoprecipitated with anti-E2F1, anti-cIAP1 or irrelevant rabbit Ig (IgG) in HeLa cells before immunoblot analysis of cIAP1 and E2F1. The cIAP1 immunoprecipitation (left) was performed in a nuclear-enriched fraction. F, immunoprecipitation analysis of the interaction of wild type or deletion mutants of cIAP1 with E2F1 and TRAF2. FLAG-conjugated proteins and E2F1 were expressed in HeLa cells and co-immunoprecipitated using anti-FLAG M2-agarose beads, then revealed by immunoblotting using an anti-E2F1, anti-TRAF2, or anti-FLAG specific antibody. A schematic representation of cIAP1 protein structure and deletion constructs used is shown (upper panel). G, GST-pull down analysis of the interaction of in vitro translated [35S]methionine-labeled cIAP1 with indicated GST-E2F1 deletion constructs. The interactions were revealed by autoradiography. E2F1 mutants (arrows) were detected after Coomassie Blue staining of the gel (lower panel). A schematic representation of E2F1 domains and deletion constructs used is shown (upper panel). CBM: cyclin A binding motif; DBD: DNA binding domain; DP: dimerization domain; TAD: C-terminal transactivation domain. Representative experiments are shown.
FIGURE 2.
FIGURE 2.
cIAP1 stimulates E2F1 transcriptional activity. A, immunoblot analysis of cIAP1 and E2F1 in HeLa cells transfected with cIAP1 construct or cIAP1 siRNA. HSC70: loading control. B–F, gene luciferase experiments performed in HeLa cells transfected with indicated promoter-luciferase reporter plasmids, along with control (Co) or E2F1-encoding vector and/or 500 ng or indicated amount (C) of empty (Co), cIAP1 or H588A (B, D) encoding constructs. p(5xE2F BS): synthetic promoter containing 5xE2F binding sites (B); p(CCNE) & wt: wt CCNE promoter (B-D, F); p(CCNA): CCNA promoter (E); mutated: E2F binding site-mutated CCNE promoter. Luciferase activity was normalized to β-galactosidase activity and expressed as fold induction of promoter stimulated by empty vector alone. Mean ± S.D. of one representative experiment. Statistical analysis performed using Student's t test. ***: p = 0.0003, n = 10 (C); *: p = 0.013, n = 3 (E). cIAP1 and E2F1 overexpression were checked by immunoblot analysis (B right panels, C lower panel). G and H, quantitative RT-PCR analysis of CCNE or birc2 mRNA in HeLa cells transfected with empty or cIAP1 encoding vectors and/or E2F1-siRNA (si-E2F1). Results are normalized to HPRT mRNA and expressed relative to empty vector (G) or expressed as % of CCNE mRNA induced by cIAP1 in the presence of control siRNA (H). Mean ± S.D. of one representative experiment. Statistically significant differences (**, p = 0.007, n = 3, Student's t test) (G). I, immunoblot analysis of cIAP1 and cyclin E in HT-29 cells transfected with cIAP1 construct. The relative expression of cyclin E in cIAP1-transfected cells compared with empty vector as evaluated after quantification using ImageJ software was shown on the blot. HSC70: loading control.
FIGURE 3.
FIGURE 3.
Specific activity of cIAP1 on E2F1. Gene luciferase experiments performed in HeLa cells transfected with a synthetic promoter containing 5xE2F binding sites (p(5xE2F BS))(A, C) or CCNE promoter-luciferase reporter plasmid (p(CCNE)) (B) along with E2F1 (A-C), E2F2 or E2F3a constructs (C), and/or 500 ng of empty vector or cIAP1 (A-C), cIAP2- or XIAP (A, B)-encoding constructs. Luciferase activity was normalized to β-galactosidase activity and expressed as fold induction of promoter stimulated by empty vector alone. Mean ± S.D. of one representative experiment is shown. The expression of indicated constructs was checked by immunoblot analysis (lower panels). HSC70: loading control. One representative experiment is shown.
FIGURE 4.
FIGURE 4.
cIAP1 is recruited on E2F binding site of CCN promoters. Chromatin immunoprecipitation experiments performed using an anti-E2F1 (A, B, E), anti-cIAP1 (A, C–E), or an irrelevant antibody (Ig) in HeLa (A–E), U-2 OS, HT-29, THP1, HMEC (C), and CD34+ primary myeloid cells (D). The genomic DNA region encompassing one E2F binding site of the CCNE (p(CCNE) (B, C, E), CCNA (p(CCNA) promoters (D) or a control sequence localized in CCNE gene (B, C left panels) were amplified by PCR (A) or qPCR (B–E). E, ChIP and re-ChIP experiments performed on HeLa cells. The sample was first immunoprecipitated with E2F1 or irrelevant antibody (Ig). The protein-DNA complex was eluted, and a second ChIP was performed using cIAP1 or irrelevant Ab. Results were normalized to input and expressed as relative recruitment compared with irrelevant antibody. Mean ± S.D. of one representative experiment.
FIGURE 5.
FIGURE 5.
The recruitment of cIAP1 on CCN promoters is cell cycle-regulated. A–D, HeLa cells were synchronized into early S phase by a thymidine double block and analyzed 0, 2, 4, 8, and 10 h after block release (see also supplemental Figs. S4 and S5). A, immunoblot analysis of cIAP1, cyclin E and B and E2F1. HSC70: loading control. B, endogenous E2F1 was immunoprecipitated with anti-E2F1 or irrelevant rabbit Ig (IgG) before immunoblot analysis of cIAP1 and E2F1. C and D, ChIP experiments of E2F1 (C) or cIAP1 (D) on CCNE (p(CCNE)) (C and D left panels) or CCNA (p(CCNA)) (C and D, right panels) promoter. E, ChIP of E2F1 and cIAP1 on CCNA promoter performed in undifferentiated (CD34+) and M-CSF-differentiated (CD34/CD14+) myeloid cells. The genomic DNA region encompassing the E2F-binding site of CCNE or CCNA promoter was amplified by qPCR. Results were normalized to input and expressed as relative recruitment to irrelevant antibody (dotted line). Mean ± S.D. of one representative experiment.
FIGURE 6.
FIGURE 6.
Contribution of cIAP1 in the transcriptional activity of E2F1. A, quantitative RT-PCR analysis of ccne (right panel), e2f1 (medium panel), and birc2 (left panel) mRNAs in HeLa cells transfected with empty or E2F1-encoding vector and control (Co) or cIAP1-targeted siRNA. Results were normalized to cyclophilin mRNA and expressed relative to empty vector. Mean ± S.D. of one representative experiment. Statistically significant differences (*, p < 0.05, n = 3, Student's t test). B, efficacy of cIAP1 or E2F1-targeted siRNAs was checked by an immunoblot analysis. HSC70: loading control. C, D and F, G, chromatin immunoprecipitation experiments performed using an anti-E2F1 or an anti-cIAP1 (C, D, F), an anti-acetyl histone H3 (Ac H3) or an anti-dimethyl histone H3 on lysine 9 (diMe H3K9) (G) or an irrelevant antibody (Ig) in HeLa (C, D, G) or CaSki (F) cells. The genomic DNA region encompassing the E2F-binding site of the CCNE promoter was amplified by PCR (C) or qPCR (D, F, G). Results are normalized to input and expressed as relative recruitment compared with irrelevant antibody. Mean ± S.D. of one representative experiment (D, F, G) is shown. MW: molecular weight. The efficacy of cIAP1-targeted siRNAs was checked by an immunoblot analysis (F, upper panel). HSC70: loading control. E, immunoblot analysis of cIAP1, XIAP, E2F1, cyclin E, and cyclin A in the cytoplasm (C)- and nucleus (N)-enriched fractions of HeLa and CaSki cells. HSC70: loading control.
FIGURE 7.
FIGURE 7.
Down-regulation of cIAP1 modulates cyclin expression. cIAP1 was down-regulated in HeLa (A–C), HMEC (C) CaSki, B16F10, L929 cells or MEF (D) by using siRNA (A–D) or in THP1 by transfecting an cIAP1 antisense (AS) encoding construct (C). A, RT-PCR analysis of indicated mRNAs. β-2 microglobulin (β-2m) was used as control. B, RT-qPCR analysis of ccne (E) and ccna (A) mRNAs. Results are normalized to cyclophilin mRNA. Statistically significant differences (***, p < 0.005, n = 5, Student's t test). C, immunoblot analysis of indicated proteins in HeLa and HMEC cells transfected with cIAP1 siRNA or in THP1 transfected with an cIAP1 antisense (AS) encoding construct. HSC70: loading control. D, upper panels, RT-qPCR analysis of ccne mRNA in indicated cell lines. Results are normalized to cyclophilin mRNA. Lower panels, immunoblot analysis of cIAP1. HSC70: loading control. E, immunoblot analysis of cIAP1, XIAP, and E2F1 in the cytoplasm (C)- and nucleus (N)-enriched fractions of indicated cell lines. HSC70: loading control. F, immunoblot analysis of cIAP1, XIAP, and E2F1 in the cytoplasm (C)- and nucleus (N)-enriched fractions of MEF cIAP1−/− transfected with cIAP1 construct. HSC70: loading control. G, RT-qPCR analysis of ccne and birc2 mRNA in MEF transfected with the cIAP1 construct. Results are normalized to cyclophilin mRNA.
FIGURE 8.
FIGURE 8.
Down-regulation of cIAP1 modulates cell proliferation and cell cycle repartition. A, flow cytometry analysis of cell proliferation in HeLa cells transfected with control (si-Co) or cIAP1 (si-cIAP1) siRNA and cIAP1-encoding construct in the presence or not of zVAD-fmk 10 μm. Results: mean ± S.D. of at least three independent experiments. Statistically significant differences (**, p < 0.001, n = 5, Student's t test). B, cell proliferation was assessed by cell counting in THP1 clone transfected with empty or cIAP1 antisense (AS)-encoding construct as in Fig. 7C. Results are expressed as mean ± S.D. of at least three independent experiments. C and D, cell cycle analysis in HeLa cell transfected with Co or cIAP1-siRNA. The cell cycle is evaluated in by flow cytometry after BrdU and PI staining of cells. D, percentage of cell in G0/G1 phase of the cell cycle as analyzed by flow cytometry in HeLa cells transfected with control (Co) or cIAP1 siRNA or in THP1 cells transfected with empty vector (V) or an cIAP1 antisense encoding vector (AS). Mean ± S.D. of at least three independent experiments is shown. Statistically significant differences (*, p < 0.05, n = 3, Student's t test). E, flow cytometry analysis of EDu incorporation in HMEC cells transfected with control (si-Co) or cIAP1 (si-cIAP1) siRNA as in Fig. 7C. One representative experiment was shown. F, flow cytometry analysis of EDu incorporation in MEF cIAP1−/− transfected with cIAP1 encoding construct as in Fig. 7F. One representative experiment is shown.

References

    1. Dubrez-Daloz L., Dupoux A., Cartier J. (2008) Cell Cycle 7, 1036–1046 - PubMed
    1. Gyrd-Hansen M., Meier P. (2010) Nat. Rev. Cancer 10, 561–574 - PubMed
    1. Varfolomeev E., Vucic D. (2008) Cell Cycle 7, 1511–1521 - PubMed
    1. Varfolomeev E., Blankenship J. W., Wayson S. M., Fedorova A. V., Kayagaki N., Garg P., Zobel K., Dynek J. N., Elliott L. O., Wallweber H. J., Flygare J. A., Fairbrother W. J., Deshayes K., Dixit V. M., Vucic D. (2007) Cell 131, 669–681 - PubMed
    1. Vince J. E., Wong W. W., Khan N., Feltham R., Chau D., Ahmed A. U., Benetatos C. A., Chunduru S. K., Condon S. M., McKinlay M., Brink R., Leverkus M., Tergaonkar V., Schneider P., Callus B. A., Koentgen F., Vaux D. L., Silke J. (2007) Cell 131, 682–693 - PubMed

Publication types

MeSH terms