. 2011 Jun 8;31(23):8464-75.
doi: 10.1523/JNEUROSCI.6382-10.2011.

Cell-type-specific modulation of feedback inhibition by serotonin in the hippocampus

Affiliations

Cell-type-specific modulation of feedback inhibition by serotonin in the hippocampus

Jochen Winterer et al. J Neurosci. .

Abstract

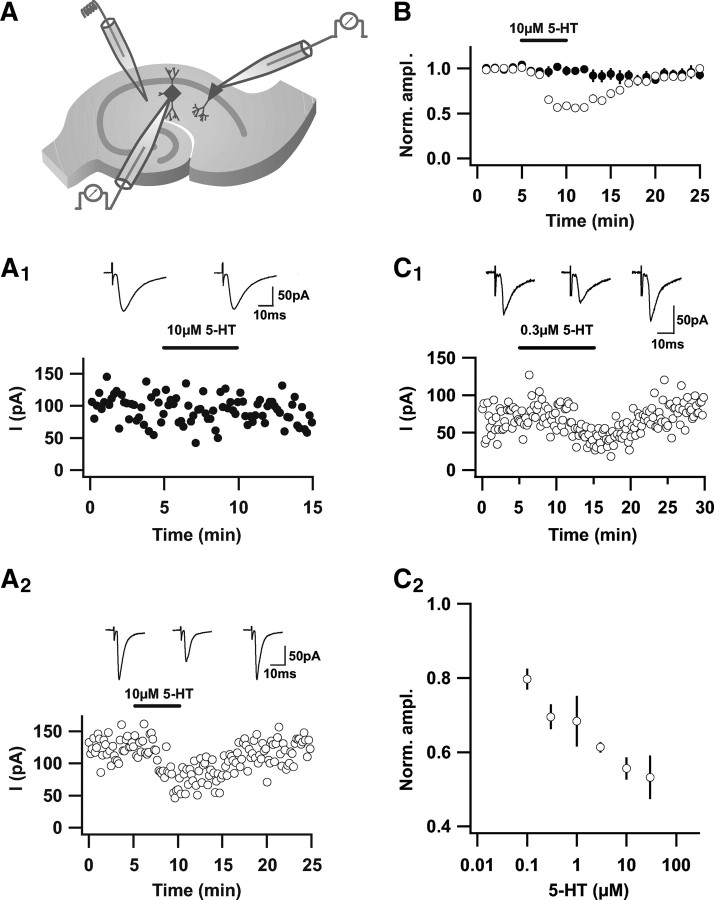
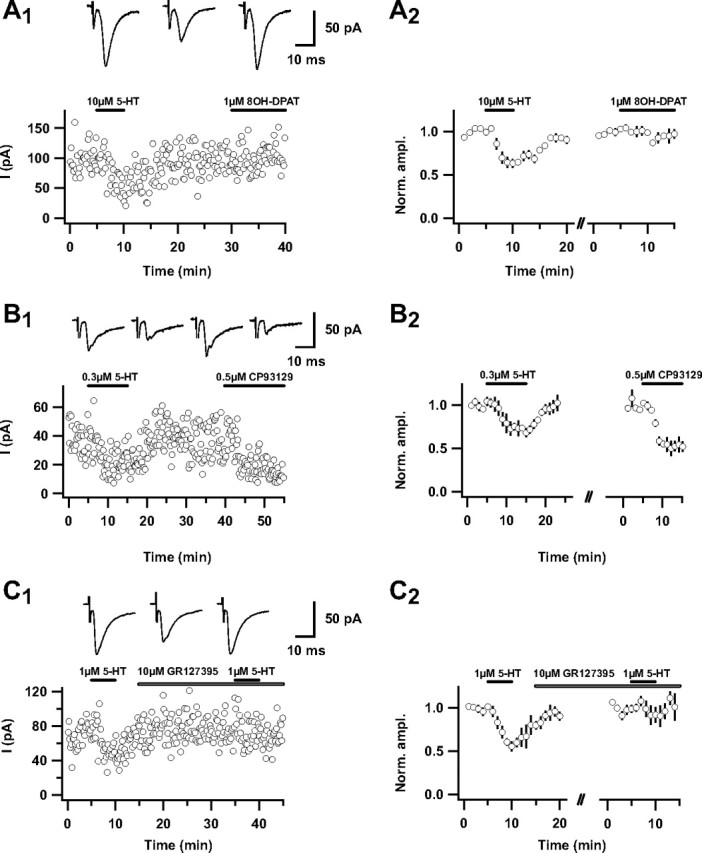
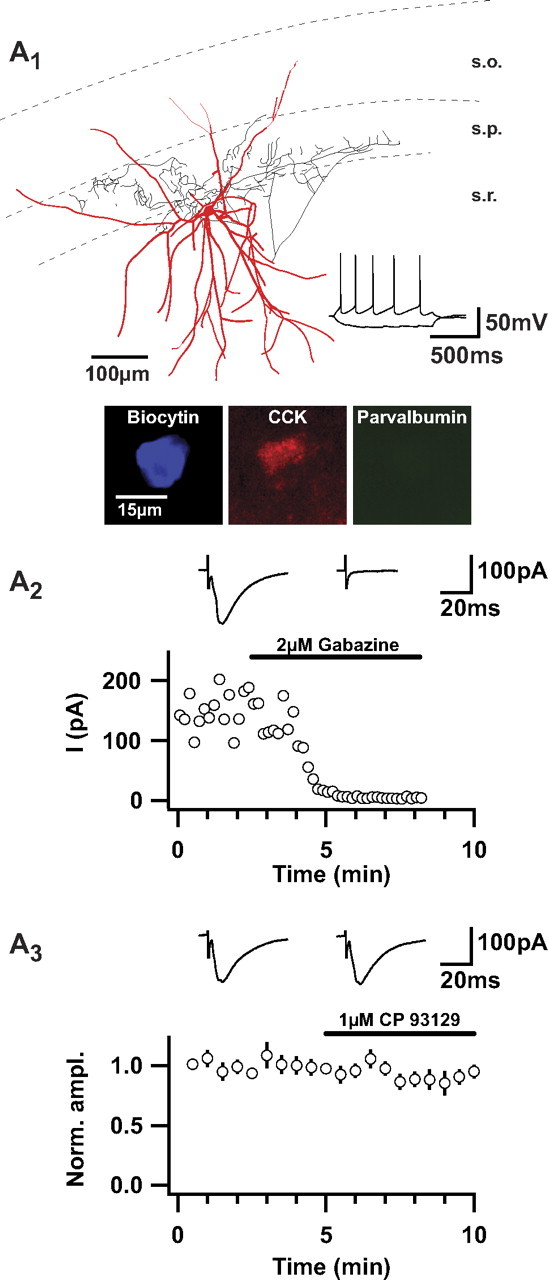
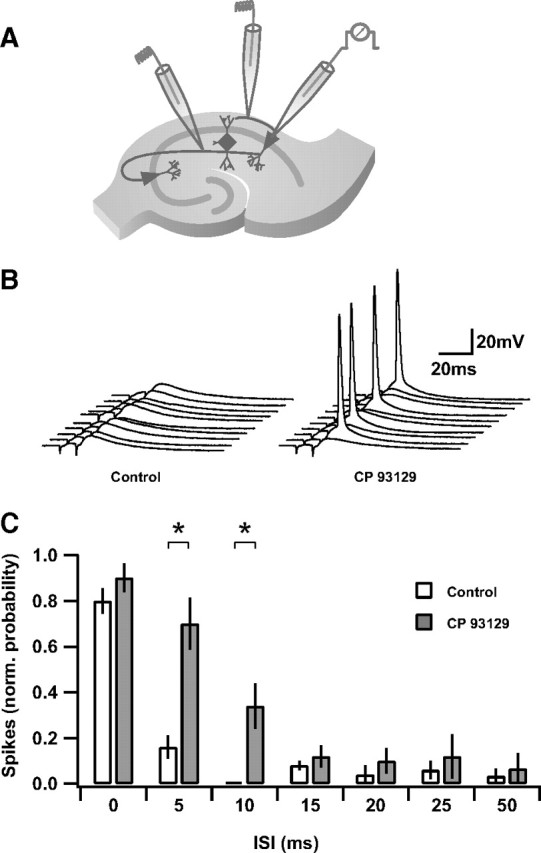
Midbrain raphe nuclei provide strong serotonergic projections to the hippocampus, in which serotonin (5-HT) exerts differential effects mediated by multiple 5-HT receptor subtypes. The functional relevance of this diversity of information processing is poorly understood. Here we show that serotonin via 5-HT(1B) heteroreceptors substantially reduces synaptic excitation of cholecystokinin-expressing interneurons in area CA1 of the rat hippocampus, in contrast to parvalbumin-expressing basket cells. The reduction is input specific, affecting only glutamatergic synaptic transmission originating from CA1 pyramidal cells. As a result, serotonin selectively decreases feedback inhibition via 5-HT(1B) receptor activation and subsequently increases the integration time window for spike generation in CA1 pyramidal cells. Our data imply an important role for serotonergic modulation of GABAergic action in subcortical control of hippocampal output.


Figures

Figure 1.
Figure 1.
Distinct modulation of glutamatergic transmission onto pyramidal cells and interneurons by 5-HT (Vholding = −60 mV). A, Schematic of the recording configuration (note that the single-cell recordings from the pyramidal cells and the interneurons were not done simultaneously in this set of experiments). A1, Top, Example traces of EPSCs in a CA1 pyramidal cell evoked by stimulation in stratum radiatum before and in 10 μm 5-HT. Bottom, Time course of the measured EPSCs in the same cell. Calibration: 50 pA, 10 ms. A2, Top, Example traces of EPSCs in an interneuron evoked by stimulation in stratum radiatum before, in 10 μm 5-HT, and after washout. Bottom, Time course of the measured EPSCs in the same cell. Calibration: 50 pA, 10 ms. B, Summary of the time course of normalized and binned (1 min) EPSC amplitudes for pyramidal cell recordings (filled circles; n = 7) and 5-HT-sensitive interneurons [open circles; n = 18, selected from all 5-HT-sensitive interneurons (65.1%) of n = 86 recorded interneurons]. Interneurons were included as serotonin sensitive if the reduction of the EPSC amplitude after application of 10 μm 5-HT was ≥30% of the baseline response and if this reduction was reversible. Black bar indicates the application of 10 μm 5-HT. C1, C2, Concentration dependency of 5-HT effect onto interneurons. C1, Top, Example traces of EPSCs in an interneuron evoked by stimulation in stratum radiatum before, in 0.3 μm 5-HT, and after washout. Bottom, Time course of the measured EPSCs in the same cell. Black bar indicates application of 0.3 μm 5-HT. Calibration: 50 pA, 10 ms). C2, Dose–response curve for 5-HT concentrations. Normalized EPSC amplitudes are plotted against logarithmic scaled 5-HT concentrations (0.1 μm, n = 3; 0.3 μm, n = 8; 1 μm, n = 9; 3 μm, n = 2; 10 μm, n = 31; and 30 μm, n = 3).
Figure 2.
Figure 2.
Characterization of morphological, immunohistochemical, and firing properties of serotonin-sensitive and serotonin-insensitive interneurons. Top, Reconstruction and spike pattern of a CCK-positive basket cell (A1a), a CCK-positive Schaffer-collateral-associated interneuron (A1b), and a PV-positive basket cell (B1). Scale bars, 100 μm. Bottom, Immunohistochemistry of biocytin-filled CCK-positive cell body (A1a, A1b) and PV-positive cell body (B1) of the reconstructed interneurons. A2a, A2b, B2, Top, Example traces of EPSCs of the characterized cells before, in 10 μm 5-HT, and after washout. Bottom, Time courses of EPSCs in the same cells. A3a, Summary of the time course of normalized and binned (0.5 min) EPSC amplitudes (n = 8 for CCK-positive basket cells). A3b, Summary of the time course of normalized and binned (0.5 min) EPSC amplitudes (n = 2 for all CCK-positive Schaffer-collateral-associated interneurons). B3, Summary of the time course of normalized and binned (0.5 min) EPSC amplitudes (n = 9 for fast-spiking interneurons, including 7 basket cells, of which 4 were PV positive; 1 fast-spiking interneuron showed PV-positive staining, but the axonal arborization was lost; 1 fast-spiking interneuron could not be reconstructed). Black bars indicate the application of 10 μm 5-HT. s.o., Stratum oriens; s.p., stratum pyramidale; s.r., stratum radiatum.
Figure 3.
Figure 3.
Presynaptic 5-HT receptors mediate the reduction of EPSC amplitudes. A, Top, Example traces show paired-pulse (pp) facilitation (50 ms interstimulus interval) in control conditions, in 10 μm 5-HT, and in 10 μm 5-HT, scaled to the peak of first EPSC amplitude under control conditions. Calibration: 25 pA, 25 ms. Note the relative increase in the second EPSC amplitude in 10 μm 5-HT. Bottom, Summary of the time course of the normalized and binned (1 min) first EPSC (open circles) and of the normalized and binned (1 min) paired-pulse ratio (filled circles; n = 16). Black bar indicates application of 10 μm 5-HT. B, Top, Time course of a single experiment showing synaptic failures in control and in 10 μm 5-HT. Bottom, Summary graph of the probability of synaptic failures in control and in 10 μm 5-HT (n = 6; p < 0.05, paired t test). C, Coefficient of variation (n = 26). Filled circles indicate minimal stimulation experiments (n = 6). D, Top, Example traces for stimulus-evoked EPSCs and glutamate-evoked currents under control conditions and in 10 μm 5-HT. Bottom, Summary (n = 5) of the time course of normalized and binned (1 min) stimulus-evoked EPSCs (open circles) and glutamate-evoked currents (filled circles). Black bar indicates application of 10 μm 5-HT.
Figure 4.
Figure 4.
The reduction in glutamatergic transmission is mediated by 5-HT1B receptors. A1, Top, Example traces of EPSCs in control conditions, in 10 μm 5-HT, and in 1 μm 8-OH-DPAT. Bottom, Time course of EPSCs in the same cell. Black bars indicate the application of 10 μm 5-HT and the application of 1 μm 8-OH-DPAT. A2, Summary of the time course of normalized and binned (1 min) EPSC amplitudes (n = 6). B1, Top, Example traces of EPSCs in control conditions, in 0.3 μm 5-HT, after wash out, and in 0.5 μm CP93129. Bottom, Time course of EPSCs in the same cell. Black bars indicate the application of 0.3 μm 5-HT and the application of 0.5 μm CP93129. B2, Summary of the time course of normalized and binned (1 min) EPSC amplitudes (n = 5). C1, Top, Example traces of EPSCs in control, in 1 μm 5-HT, and in 10 μm GR127395 and 1 μm 5-HT. Bottom, Time course of EPSCs in the same cell. Black bars indicate the application of 1 μm 5-HT. The application of 10 μm GR127395 is indicated as open bar. C2, Summary of the time course of normalized and binned (1 min) EPSC amplitudes (n = 5).
Figure 5.
Figure 5.
Fenfluramine mimics the effect of 5-HT on interneurons. A1, Top, Example traces of EPSCs in control conditions, in 10 μm 5-HT, after washout, and in 200 μm fenfluramine (Fenfl.). Middle, Time course of EPSCs in the same cell. Black bars indicate the application of 10 μm 5-HT and the application of 200 μm fenfluramine. Bottom, Summary of the time course of normalized and binned (1 min) EPSC amplitudes (n = 5). Fenfluramine has no effect on EPSCs in pyramidal cells (A2) and fast-spiking interneurons (A3). A2, A3, Top, Example traces of EPSCs in control conditions and in 200 μm fenfluramine. Bottom, Summary of the time course of normalized and binned (1 min) EPSC amplitudes in pyramidal cells (A2; n = 5) and fast-spiking interneurons (A3; n = 5). B, Paired-pulse ratio is increased from baseline: 1.00 ± 0.03 to 2.46 ± 1.15 in 10 μm 5-HT and after washout of 5-HT from 1.11 ± 0.10 to 2.42 ± 0.78 in 200 μm fenfluramine (n = 4). C, GR127935 antagonizes fenfluramine. Top, Example traces of EPSCs in 10 μm GR127935 and in 10 μm GR127935 and 200 μm fenfluramine. Middle, Time course of EPSCs in the same cell. Bottom, Summary of the time course of normalized and binned (1 min) EPSC amplitudes (n = 5). Black bar indicates the application of 200 μm fenfluramine. D, Summary graph of the percentage of inhibition of normalized EPSC amplitudes 5 min after application of fenfluramine in regular-spiking interneurons (RS), in regular-spiking interneurons with the antagonist GR127935 (GR), in fast-spiking interneurons (FS), and in CA1 pyramidal neurons (Pyr.).
Figure 6.
Figure 6.
5-HT1B receptor signaling does not affect inhibition in CCK-positive interneurons. A1, Top, Reconstruction and spike pattern of a CCK-positive basket cell. Bottom, Immunohistochemistry of biocytin-filled CCK-positive cell body of the reconstructed interneuron. A2, Top, Example traces of stimulus-induced monosynaptic IPSCs before and after application of 2 μm gabazine. Bottom, Time course of IPSCs in a CCK-positive basket cell; application of 2 μm gabazine confirms the inhibitory input. A3, Top, Example traces of stimulus-induced monosynaptic IPSCs before and after application of 1 μm CP93129 of the characterized cell. Bottom, Summary of the time course of normalized and binned (0.5 min) IPSC amplitudes (n = 6). Black bar indicates the application of 1 μm CP93129. s.o., Stratum oriens; s.p., stratum pyramidale; s.r., stratum radiatum.
Figure 7.
Figure 7.
The depression of glutamate transmission by serotonin is input specific. A, B, C, Schematic of the recording configuration. A1, B1, C1, Top, Reconstruction and spike pattern of a CCK-positive Schaffer-collateral-associated interneuron (A1), a CCK-positive basket cell (B1), and a fast-spiking basket cell (C1). Scale bars, 100 μm. Bottom, Immunohistochemistry of biocytin-filled CCK-positive cell body and dendrite (A1, B1). A2, B2, C2, Top, Example traces of EPSCs evoked by local uncaging of glutamate in area CA3 (A2) and area CA1 (B2, C2) before and in 0.5 μm CP93129 of the characterized cells. Bottom, Time courses of EPSCs in the same cells. Summary of the time course of normalized and binned (1 min) EPSC amplitudes for CCK-positive interneurons (n = 6) evoked by local uncaging in CA3 (A3), for CCK-positive interneurons (B3; n = 9), and fast-spiking interneurons (n = 3) evoked by local uncaging in CA1 (C3). s.o., Stratum oriens; s.p., stratum pyramidale; s.r., stratum radiatum.
Figure 8.
Figure 8.
5-HT reduces feedback inhibition in CA1 pyramidal cells. A, Top, Schematic of the recording configuration. Bottom, Time course of IPSCs in an example cell. Black bars indicate the application of 10 μm 5-HT. Inset, Example traces of EPSC–IPSC sequences stimulated in the alveus in control conditions and in 10 μm 5-HT. Calibration: 100 pA, 50 ms. B, Top, Example traces of monosynaptic IPSCs elicited in stratum radiatum in control conditions and in 1 μm CP93129. Bottom, Time course of the normalized and binned (1 min) monosynaptic IPSCs (n = 6). Black bar indicates the application of 0.5–1 μm CP93129. Calibration: 100 pA, 50 ms. C1, Left, Schematic of the recording configuration. Right, Example traces (single sweeps) of EPSPs stimulated in the alveus in control conditions and in 1 μm CP93129. Calibration: 50 mV, 50 ms. Inset, Example traces of EPSPs without spikes (average of 6 sweeps) in control and in 1 μm CP93129. Calibration: 10 mV, 200 ms. C2, Time course of the same experiment. Black bar indicates the application of 1 μm CP93129 and 10 μm NBQX. C3, Summary graph of the normalized spike probability in control conditions and in 1 μm CP93129 (n = 5, 4 interneurons could be reconstructed as regular spiking basket cells, of which 3 were CCK positive, 1 reconstruction failed; spike probability in control conditions, 57.0 ± 0.09 vs 0% in CP93129; p < 0.05, paired t test;).
Figure 9.
Figure 9.
5-HT increases the integration time window for spike timing in CA1 pyramidal cells. A, Schematic of the recording configuration. B, Example traces (single sweeps) of EPSP–IPSP sequences stimulated in the alveus followed by EPSP–IPSP sequences elicited by Schaffer-collateral stimulation in control and in 1 μm CP93129 [interstimulus interval (ISI), 10 ms]. C, Summary graph of the normalized spike probability at different interstimulus intervals (n = 5; for 5 and 10 ms interstimulus intervals, *p < 0.05, paired t test).

References

    1. Andrade R, Nicoll RA. Pharmacologically distinct actions of serotonin on single pyramidal neurones of the rat hippocampus recorded in vitro. J Physiol. 1987;394:99–124. - PMC - PubMed
    1. Barnes NM, Sharp T. A review of central 5-HT receptors and their function. Neuropharmacology. 1999;38:1083–1152. - PubMed
    1. Bendels MH, Beed P, Leibold C, Schmitz D, Johenning FW. A novel control software that improves the experimental workflow of scanning photostimulation experiments. J Neurosci Methods. 2008;175:44–57. - PubMed
    1. Best AR, Regehr WG. Serotonin evokes endocannabinoid release and retrogradely suppresses excitatory synapses. J Neurosci. 2008;28:6508–6515. - PMC - PubMed
    1. Boeijinga PH, Boddeke HW. Activation of 5-HT1B receptors suppresses low but not high frequency synaptic transmission in the rat subicular cortex in vitro. Brain Res. 1996;721:59–65. - PubMed

Publication types

MeSH terms