. 2011 Jun 8;31(23):8491-501.
doi: 10.1523/JNEUROSCI.5317-10.2011.

Specific regulation of NRG1 isoform expression by neuronal activity

Affiliations

Specific regulation of NRG1 isoform expression by neuronal activity

Xihui Liu et al. J Neurosci. .

Abstract

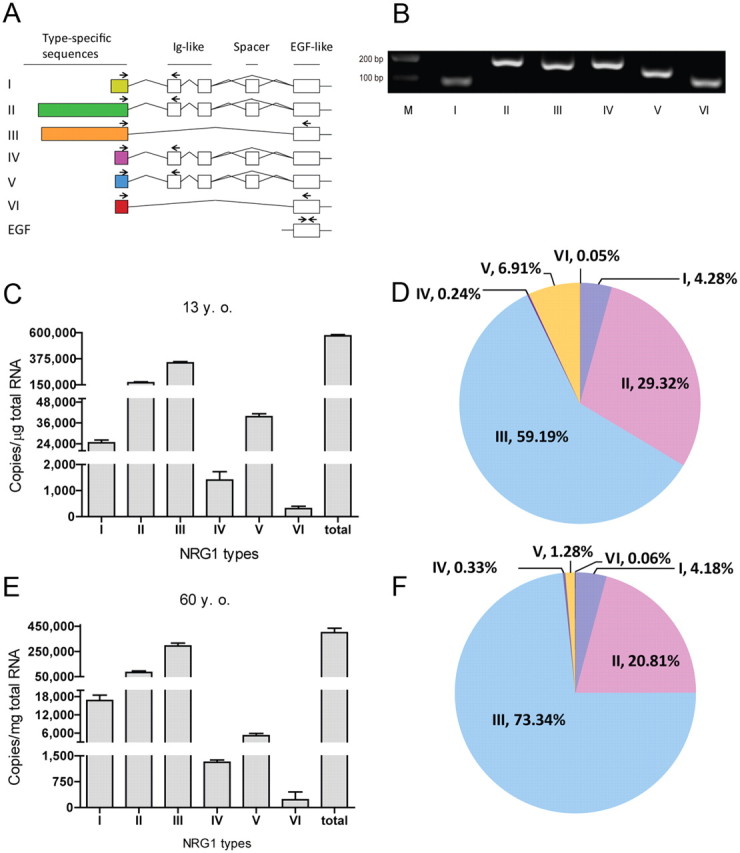
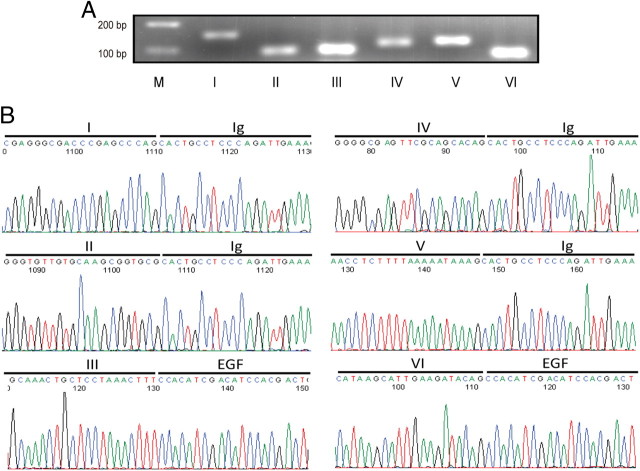
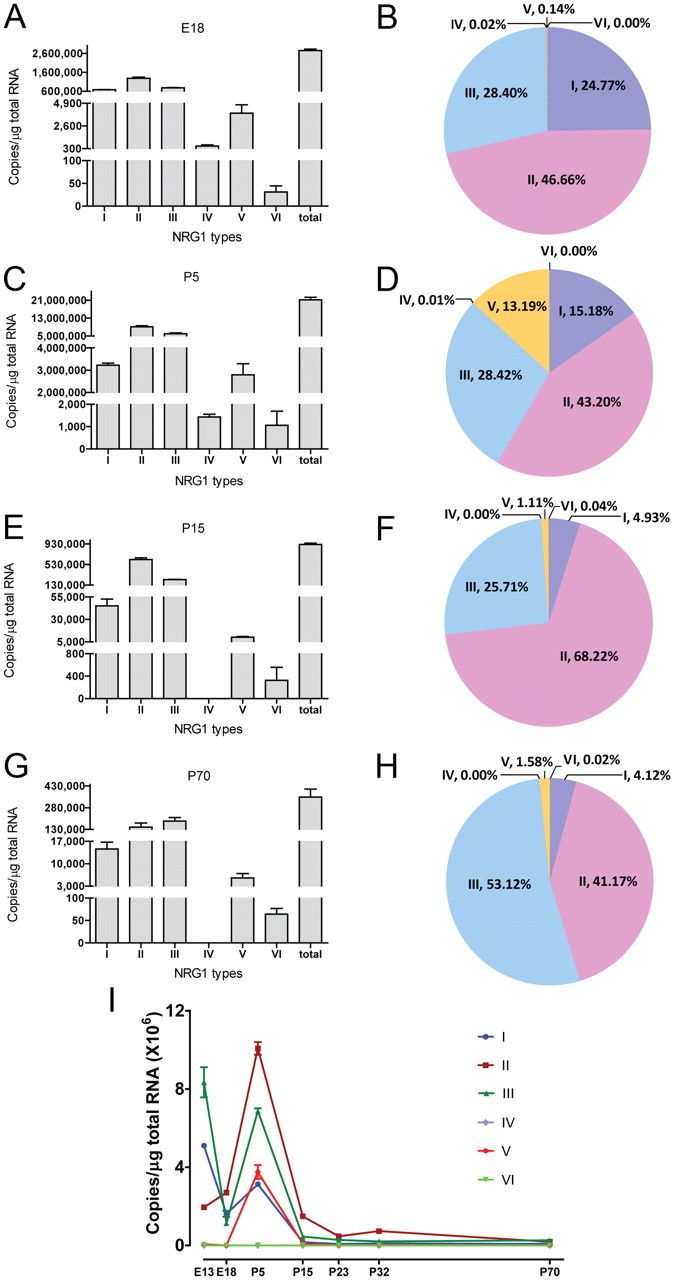
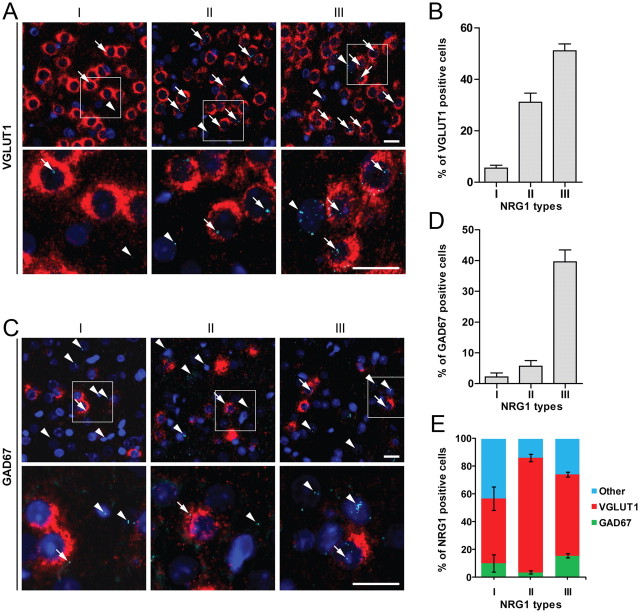
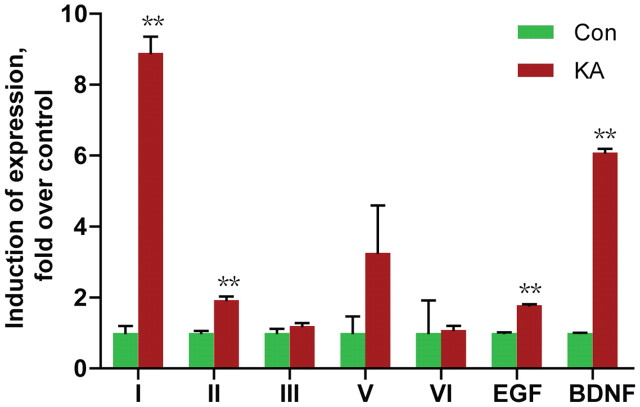
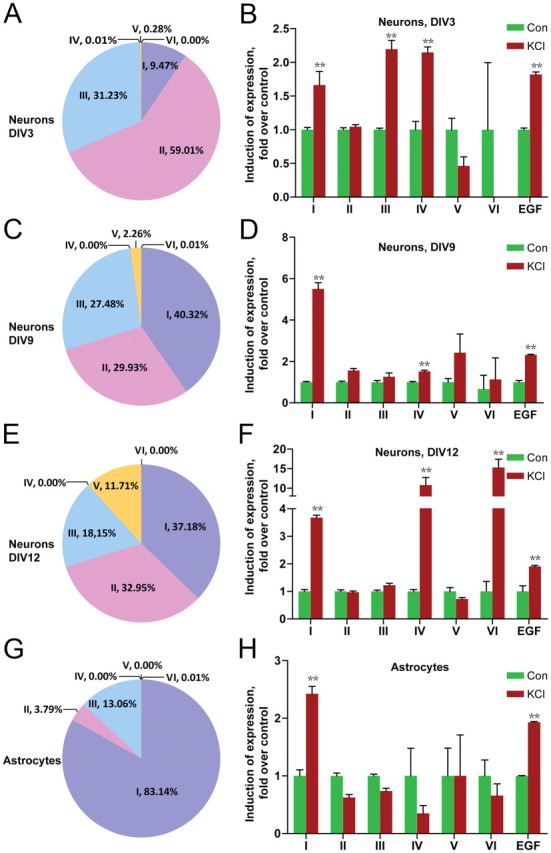
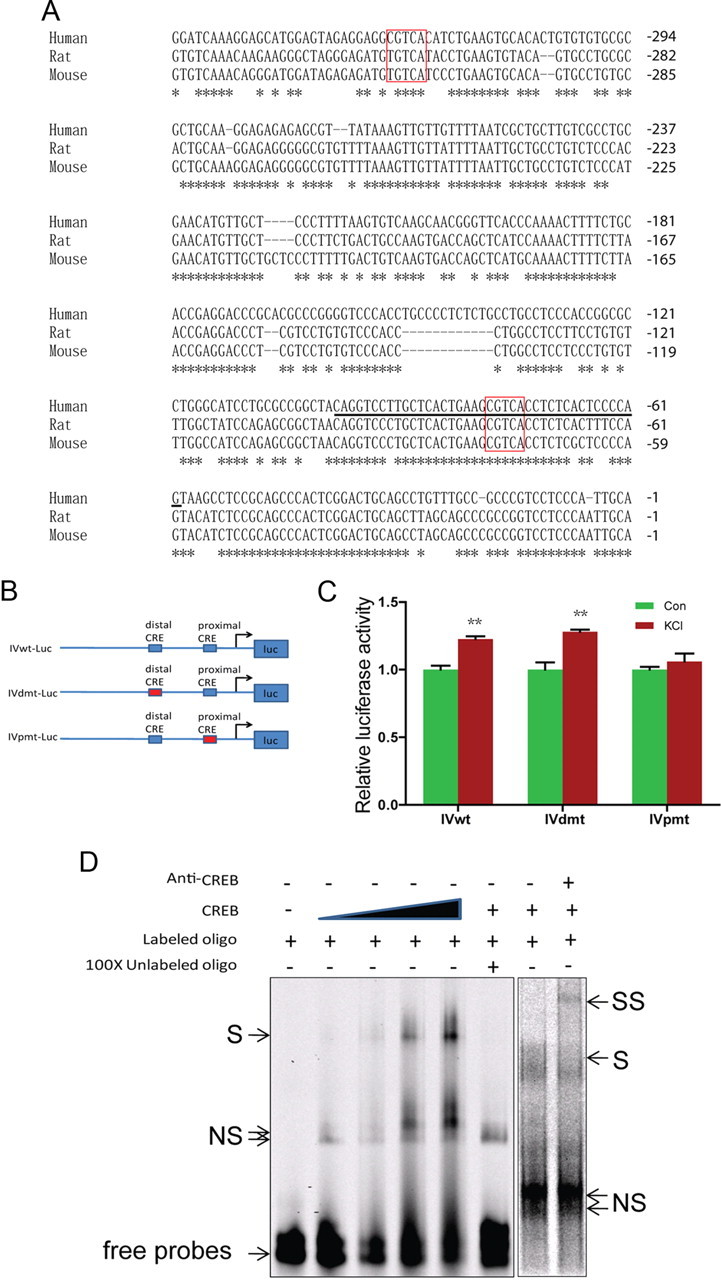
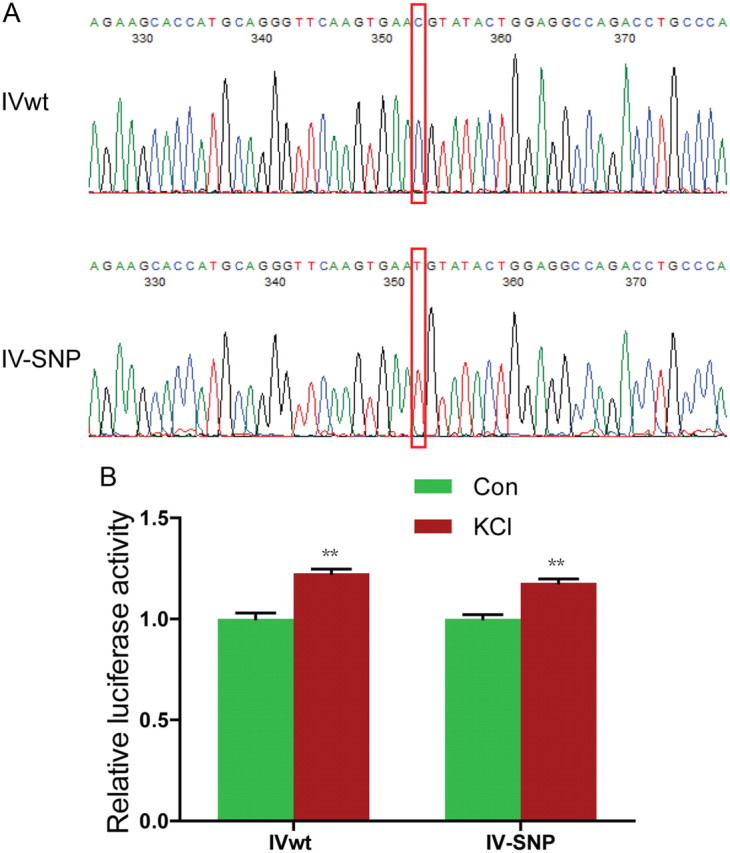
Neuregulin 1 (NRG1) is a trophic factor that has been implicated in neural development, neurotransmission, and synaptic plasticity. NRG1 has multiple isoforms that are generated by usage of different promoters and alternative splicing of a single gene. However, little is known about NRG1 isoform composition profile, whether it changes during development, or the underlying mechanisms. We found that each of the six types of NRG1 has a distinct expression pattern in the brain at different ages, resulting in a change in NRG1 isoform composition. In both human and rat, the most dominant are types III and II, followed by either type I or type V, while types IV and VI are the least abundant. The expression of NRG1 isoforms is higher in rat brains at ages of E13 and P5 (in particular type V), suggesting roles in early neural development and in the neonatal critical period. At the cellular level, the majority of NRG1 isoforms (types I, II, and III) are expressed in excitatory neurons, although they are also present in GABAergic neurons and astrocytes. Finally, the expression of each NRG1 isoform is distinctly regulated by neuronal activity, which causes significant increase in type I and IV NRG1 levels. Neuronal activity regulation of type IV expression requires a CRE cis-element in the 5' untranslated region (UTR) that binds to CREB. These results indicate that expression of NRG1 isoforms is regulated by distinct mechanisms, which may contribute to versatile functions of NRG1 and pathologic mechanisms of brain disorders such as schizophrenia.


Figures

Figure 1.
Figure 1.
Distinct expression patterns of NRG1 types in the human cerebral cortex. A, Diagram of NRG1 gene structure. Type-specific forward primers (indicated by arrows) for each type were located in unique exons, whereas reverse primers were located in either Ig or EGF domain. Forward primers were also designed for EGF domain. B, Agarose gel electrophoresis of RT-qPCR products. Total RNA of human cerebral cortex was used as template in RT-qPCR with specific primers. Products were resolved on 3% agarose gel and visualized by ethidium bromide staining. Bands were at the anticipated molecular weight. Due to potential difference in PCR efficiencies, band intensity did not faithfully indicate relative amount. C, Different levels of NRG1 types in the cerebral cortex of a 13-year-old subject. D, Composition of NRG1 types in the cerebral cortex of a 13-year-old subject. E, Different levels of NRG1 types in the cerebral cortex of a 60-year-old subject. The copy numbers per microgram total RNA of each type NRG1 were 1.67 ± 0.17 × 10⁴ (type I), 8.31 ± 1.17 × 10⁴ (type II), 2.93 ± 0.23 × 10⁵ (type III), 1.31 ± 0.06 × 10³ (type IV), 5.12 ± 0.73 × 10³ (type V), and 227 ± 226 (type VI). F, Composition of NRG1 types in the cerebral cortex of a 60-year-old subject.
Figure 2.
Figure 2.
Expression of all six types of NRG1 in rat brain. RT-qPCR was performed using the same strategy as described in Figure 1A. A, Agarose gel electrophoresis of RT-qPCR products. Total RNA of E18 rat brain was used as template in RT-qPCR with specific primers. Products were resolved on 3% agarose gel and visualized by ethidium bromide staining. Bands were at the anticipated molecular weight. Due to potential difference in PCR efficiencies, band intensity did not faithfully indicate relative amount. B, DNA sequence analysis of RT-qPCR products. RT-qPCR products were purified and subcloned into pGEM-T easy vector (Promega) for sequencing with T7 primer. Shown were partial DNA sequences of respective domains.
Figure 3.
Figure 3.
Development-dependent expression of NRG1 types. RT-qPCR was performed as described in Figure 1A with the RNA templates of cerebral cortex of different age. A, Different expression levels of NRG1 types in E18 cerebral cortex. The copy numbers per microgram of total RNA of each type of NRG1 were 6.81 ± 0.09 × 10⁵ (type I), 1.28 ± 0.06 × 10⁶ (type II), 7.81 ± 0.17 × 10⁵ (type III), 557 ± 127 (type IV), 3890 ± 850 (type V), and 31 ± 14 (type VI), whereas that for total NRG1 was 2.75 ± 0.08 × 10⁶. B, Composition of NRG1 types in E18 cerebral cortex. C, Different expression levels of NRG1 types in P5 cerebral cortex. The copy numbers per microgram of total RNA of each type NRG1 were 3.22 ± 0.10 × 10⁶ (type I), 9.16 ± 0.45 × 10⁶ (type II), 6.03 ± 0.40 × 10⁶ (type III), 1.43 ± 0.12 × 10³ (type IV), 2.79 ± 0.50 × 10⁶ (type V), and 1.06 ± 0.63 × 10³ (type VI), whereas that for total NRG1 was 2.12 ± 0.12 × 10⁷. D, Composition of NRG1 types in P5 cerebral cortex. E, Different expression levels of NRG1 types in P15 cerebral cortex. The copy numbers per microgram of total RNA of each type NRG1 were 4.51 ± 0.75 × 10⁴ (type I), 6.25 ± 0.33 × 10⁵ (type II), 2.35 ± 0.06 × 10⁵ (type III), 0 (undetectable, type IV), 1.02 ± 0.08 × 10⁴ (type V), and 3.26 ± 2.32 × 10² type VI, whereas that for total NRG1 was 9.16 ± 0.27 × 10⁷. F, Composition of NRG1 types in P15 cerebral cortex. G, Different expression levels of NRG1 types in P70 cerebral cortex. The copy numbers per microgram of total RNA of each type NRG1 were 1.46 ± 0.21 × 10⁴ (type I), 1.46 ± 0.28 × 10⁵ (type II), 1.88 ± 0.25 × 10⁵ (type III), 0 (undetectable, type IV), 5.58 ± 13.60 × 10² (type V), and 64 ± 13 (type IV), whereas that for total NRG1 was 3.54 ± 0.55 × 10⁷. H, Composition of NRG1 types in P70 cerebral cortex. I, Alteration of NRG1 types in developing cerebral cortex.
Figure 4.
Figure 4.
Expression of NRG1 isoforms in excitatory and inhibitory neurons and astrocytes. Dual FISH was performed to determine which cells in the cortex express NRG1 isoforms. A, Representative images of dual FISH of VGLUT1 (red) and NRG1 isoforms (aqua). Regions in white rectangles in the upper panels were enlarged in lower panels. Arrowheads indicate cells expressing NRG1 isoforms, but not VGLUT1. Arrows indicate cells expressing both NRG1 isoforms and VGLUT1. Scale bar, 20 μm. B, Percentage of VGLUT1-positive cells expressing NRG1 types I (5.47 ± 1.13%, n = 18), II (31.09 ± 3.58%, n = 18), or III (51.10 ± 2.71%, n = 14). C, Representative images of dual FISH of GAD67 (red) and NRG1 isoforms (aqua). Regions in white rectangles in the upper panels were enlarged in lower panels. Arrowheads indicate cells expressing NRG1 isoforms, but not GAD67. Arrows indicate cells expressing both NRG1 isoforms and GAD67. Scale bar, 20 μm. D, Percentage of GAD67-positive cells expressing NRG1 types I (2.15 ± 1.29%, n = 18), II (5.62 ± 1.83%, n = 18), or III (39.56 ± 3.91%, n = 14). E, Distribution of NRG1 isoforms in VGLUT1- (I, 46.50 ± 8.35%, n = 18; II, 82.47 ± 2.78%, n = 18; III, 58.61 ± 1.87%, n = 18) and GAD67- (I, 10.19 ± 6.20%, n = 18; II, 3.63 ± 1.23%, n = 18; III, 15.58 ± 1.64%, n = 14) positive neurons.
Figure 5.
Figure 5.
Increased expression of types I and II NRG1 in the cerebral cortex of KA-treated rats. Rats were injected with 10 mg/ml KA to induce seizure and killed 4 h after injection. Total RNAs were subjected to RT-qPCR. NRG1 types were first normalized by β-actin whose levels were revealed in same reactions and then normalized by control. **p < 0.01.
Figure 6.
Figure 6.
Differential regulation of NRG1 type expression in cultured neurons and astrocytes by KCl treatment. Total RNAs were isolated from control or KCl (50 mm, 6 h)-treated cortical neurons (A–F, indicated ages) and astrocytes (G, H), and subjected to RT-qPCR. NRG1 types were first normalized by β-actin, whose levels were revealed in the same reactions and then normalized by control. **p < 0.01.
Figure 7.
Figure 7.
CRE cis-element is critical for activity-dependent regulation of type IV NRG1. A, Sequence comparison of type I 5′UTRs of human, rat, and mouse. Distal and proximal CRE sites were highlighted in red rectangles. *Conserved nucleotides. Underlined sequence included 20 bp upstream and 15 bp downstream of CRE sites were used for EMSA. B, Diagram of luciferase reporter constructs. C, The proximal CRE cis-element was necessary for activity-dependent increase of type IV expression. SH-SY5Y cells were cotransfected with indicated reporters and pRL-TK. Twelve hours after transfection, cells were treated with vehicle or 50 mm KCl for 12 h. Luciferase activity was measured as described in Materials and Methods. **p < 0.01. D, Interaction between proximal CRE cis-element and CREB. Double-stranded oligonucleotides containing the proximal CRE of human type IV promoter (shown in Fig. 6A) were 5′ end-labeled with IRDye 700 and incubated with recombinant CREB1 for 15 min at 30°C. In some experiments, 200× unlabeled oligonucleotides or anti-CREB antibody were included in the reaction. The reaction mixture was resolved on 4% nondenaturing polyacrylamide gel. S, Shift band; SS, super shift; NS, nonspecific band.
Figure 8.
Figure 8.
SNP8NRG243177 (rs6994992) has no effect on the regulation by neuronal activity. A, DNA sequences of IVwt-Luc and IV-SNP. The C-to-T mutation was indicated by red rectangles. The backbone of the Luc constructs was described in Figure 7B. B, No effect of SNP8NRG243177 T allele on KCl-induced type IV NRG1 promoter activity. **p < 0.01.

References

    1. Alberini CM. Transcription factors in long-term memory and synaptic plasticity. Physiol Rev. 2009;89:121–145. - PMC - PubMed
    1. Anton ES, Marchionni MA, Lee KF, Rakic P. Role of GGF/neuregulin signaling in interactions between migrating neurons and radial glia in the developing cerebral cortex. Development. 1997;124:3501–3510. - PubMed
    1. Asai M, Iwasaki Y, Yoshida M, Mutsuga-Nakayama N, Arima H, Ito M, Takano K, Oiso Y. Nuclear factor of activated T cells (NFAT) is involved in the depolarization-induced activation of growth hormone-releasing hormone gene transcription in vitro. Mol Endocrinol. 2004;18:3011–3019. - PubMed
    1. Backx L, Ceulemans B, Vermeesch JR, Devriendt K, Van Esch H. Early myoclonic encephalopathy caused by a disruption of the neuregulin-1 receptor ErbB4. Eur J Hum Genet. 2009;17:378–382. - PMC - PubMed
    1. Bellocchio EE, Reimer RJ, Fremeau RT, Jr, Edwards RH. Uptake of glutamate into synaptic vesicles by an inorganic phosphate transporter. Science. 2000;289:957–960. - PubMed

Publication types

MeSH terms

LinkOut - more resources