. 2011 Aug;21(4):274-84.
doi: 10.1097/CMR.0b013e328343a1d6.

Comprehensive analysis of receptor tyrosine kinase activation in human melanomas reveals autocrine signaling through IGF-1R

Affiliations

Comprehensive analysis of receptor tyrosine kinase activation in human melanomas reveals autocrine signaling through IGF-1R

Kerrington R Molhoek et al. Melanoma Res. 2011 Aug.

Abstract

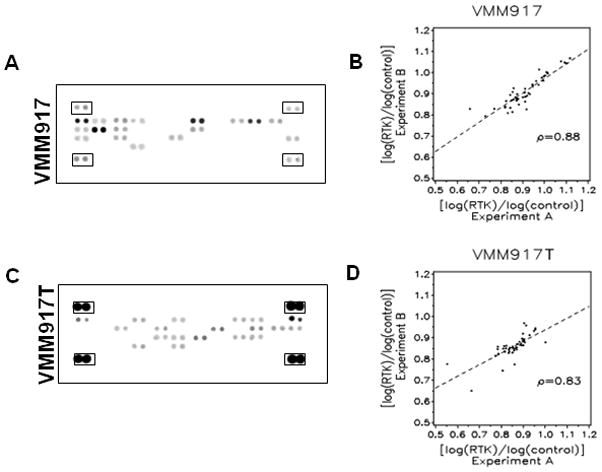
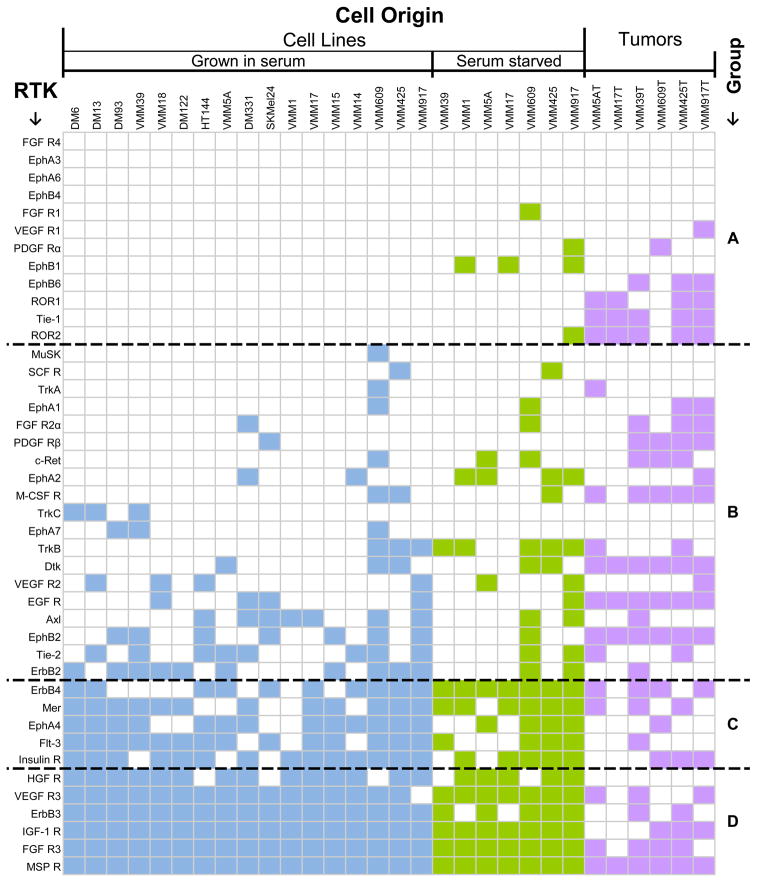
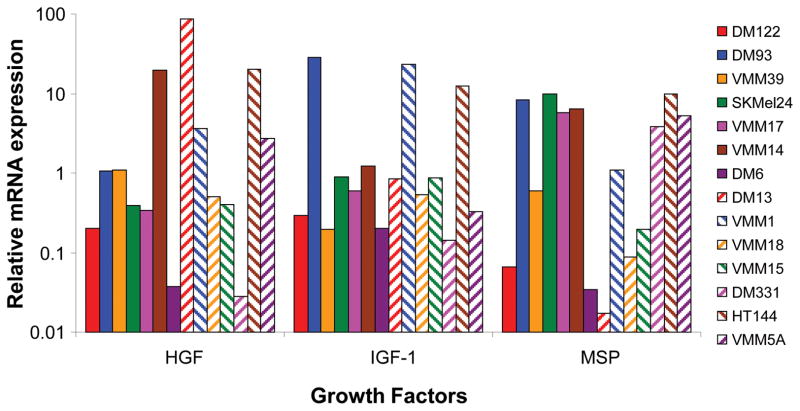
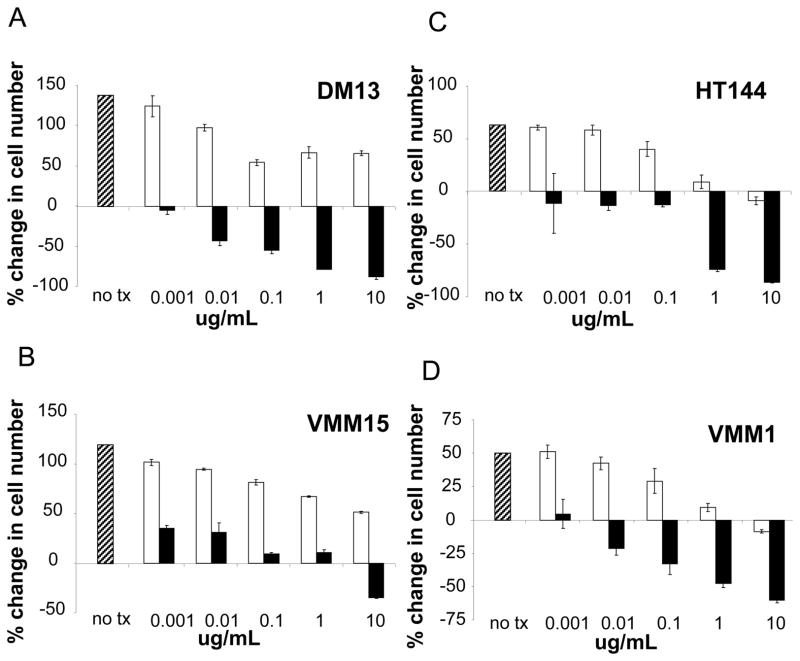
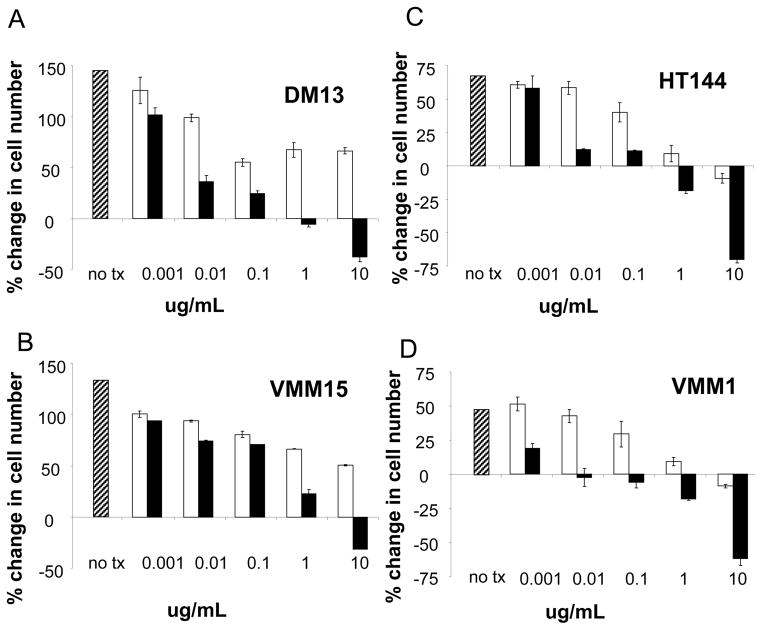
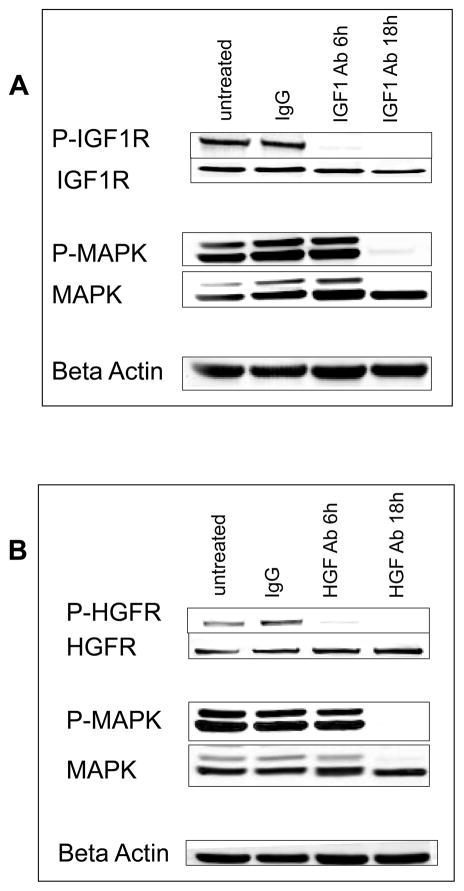
Melanomas depend on autocrine signals for proliferation and survival; however, no systematic screen of known receptor tyrosine kinases (RTKs) has been performed to identify which autocrine signaling pathways are activated in melanoma. Here, we performed a comprehensive analysis of 42 RTKs in six individual human melanoma tumor specimens as well as 17 melanoma cell lines, some of which were derived from the tumor specimens. We identified five RTKs that were active in almost every one of the melanoma tissue specimens and cell lines, including two previously unreported receptors, insulin-like growth factor receptor 1 (IGF-1R) and macrophage-stimulating protein receptor (MSPR), in addition to three receptors (vascular endothelial growth factor receptor, fibroblast growth factor receptor, and hepatocyte growth factor receptor) known to be autocrine activated in melanoma. We show, by quantitative real time PCR, that all melanoma cell lines expressed genes for the RTK ligands such as HGF, IGF-1, and MSP. Addition of antibodies to either IGF-1 or HGF, but not to MSP, to the culture medium blocked melanoma cell proliferation, and even caused net loss of melanoma cells. Antibody addition deactivated IGF-1R and hepatocyte growth factor receptors, as well as mitogen-activated protein kinase signaling. Thus, IGF-1 is a new growth factor for autocrine driven proliferation of human melanoma in vitro. Our results suggest that IGF-1-IGF-1R autocrine pathway in melanoma is a possible target for therapy in human melanomas.


Figures

Figure 1
Figure 1. Receptor tyrosine kinase phosphorylation in melanomas
A, Phospho-Receptor Tyrosine Kinase arrays with duplicate spots of capture antibodies for 42 different receptors are shown with pairs of (+) control spots at the corners (boxed) for the VMM917 melanoma cell line. The staining by SuperSignal west pico chemiluminescent substrate was exposed to film and scanned into a TIFF file and analyzed by ImageQuant TL software. B, Spearman correlation plot for the VMM917 melanoma cell line where the log of the value for the RTK is divided by the log of the value for the control for both the X axis (value from experiment A) and Y axis (value from experiment B). The Spearman correlation value was 0.88 with a p-value of < 0.01. C, Phospho-RTK arrays, as described in A, for the VMM917T melanoma tissue specimen. D, Spearman correlation plot for the phospho-RTK arrays from Experiment A and Experiment B using the VMM917T tissue specimen showed a correlation value of 0.83 with a p-value of < 0.01.
Figure 2
Figure 2. Matrix of activated RTKs in human melanoma cell lines and tissue specimens
The cell origins are plotted along the X-Axis and RTKs along the Y-Axis. RTKs were rank-ordered on the melanoma cell lines with the least activated receptors at the top. Melanoma cell lines grown in serum are shown in blue, serum-starved cell lines in green and melanoma tumor specimens in lavender. Coloration of the block on the map corresponds to phosphorylation of the RTK on the array. An empty block corresponds with no detectable phosphorylation of the RTK. The black dashed lines delineate the four groups.
Figure 3
Figure 3. Expression of HGF, IGF1, and MSP in human melanoma cell lines
Quantitative real-time PCR was performed as described in the materials and methods to determine the relative mRNA expression of growth factors IGF1, HGF and MSP in 14 melanoma cell lines. The levels were normalized to the geometric mean of GAPDH and HPRT1 as controls. Results are plotted on a logarithmic scale to allow comparison of the 1000-fold range in mRNA levels.
Figure 4
Figure 4. Anti-IGF1 antibody inhibits proliferation of human melanoma cell lines
A–D, Four melanoma cell line dose response curves are shown. The percent change in cell number versus concentration in ug/ml of antibody is shown in a cell proliferation assay using Cell Titer-Glo starting with 1,000 cells/well. Cells were cultured in media plus serum with no treatment (hatched bar), plus an IgG control antibody (white bars) as described in materials and methods, and an anti-IGF1 antibody (black bars) at concentrations ranging from 0.01 to 10 ug/ml. Error bars represent standard deviations from three independent experiments.
Figure 5
Figure 5. Anti-HGF antibody inhibits proliferation of human melanoma cell lines
A–D, Four melanoma cell line dose response curves are shown. As in Figure 4, the percent change in cell number versus concentration in ug/ml of antibody is shown in a cell proliferation assay using Cell Titer-Glo starting with 1,000 cells/well. Cells were cultured in media plus serum with no treatment (hatched bar), plus an IgG control antibody (white bars) as described in materials and methods, and an anti-HGF antibody (black bars) at concentrations ranging from 0.01 to 10 ug/ml. Error bars represent standard deviations from three independent experiments.
Figure 6
Figure 6. Signaling effects of anti-IGF1 or anti-HGF antibodies in human melanoma cells
A, DM13 melanoma cells were left untreated or treated with 10 ug/ml of IgG antibody or the anti-IGF1 antibody and then incubated for 6 or 18 hrs, at which time cells were lysed and extracts prepared. Western blot analysis of phospho-IGF1R, IGF1R, phospho-MAPK, and MAPK are shown. Beta Actin is blotted as a loading control. B, DM13 melanoma cells were left untreated or treated with 10 ug/ml of IgG antibody or the HGF antibody, and then incubated for 6 or 18 hrs, at which time cells were lysed and extracts prepared. Western blot analysis of phospho-HGFR, HGFR, phospho-MAPK, and MAPK are shown. Beta Actin is blotted as a loading control.

References

    1. Balch CM, Buzaid AC, Soong SJ, Atkins MB, Cascinelli N, Coit DG, et al. Final version of the American Joint Committee on Cancer staging system for cutaneous melanoma. J Clin Oncol. 2001;19(16):3635–48. - PubMed
    1. Kirkwood JM, Manola J, Ibrahim J, Sondak V, Ernstoff MS, Rao U. A pooled analysis of eastern cooperative oncology group and intergroup trials of adjuvant high-dose interferon for melanoma. Clin Cancer Res. 2004;10(5):1670–7. - PubMed
    1. Lazar-Molnar E, Hegyesi H, Toth S, Falus A. Autocrine and paracrine regulation by cytokines and growth factors in melanoma. Cytokine. 2000;12(6):547–54. - PubMed
    1. Albino AP. The role of oncogenes and growth factors in progressive melanoma-genesis. Pigment Cell Res. 1992;(Suppl 2):199–218. - PubMed
    1. Shih IM, Herlyn M. Autocrine and paracrine roles for growth factors in melanoma. In Vivo. 1994;8(1):113–23. - PubMed

Publication types