Comparative Study
. 2011 Jun 7:7:497.
doi: 10.1038/msb.2011.28.

RNA sequencing reveals two major classes of gene expression levels in metazoan cells

Affiliations
Comparative Study

RNA sequencing reveals two major classes of gene expression levels in metazoan cells

Daniel Hebenstreit et al. Mol Syst Biol. .

Abstract

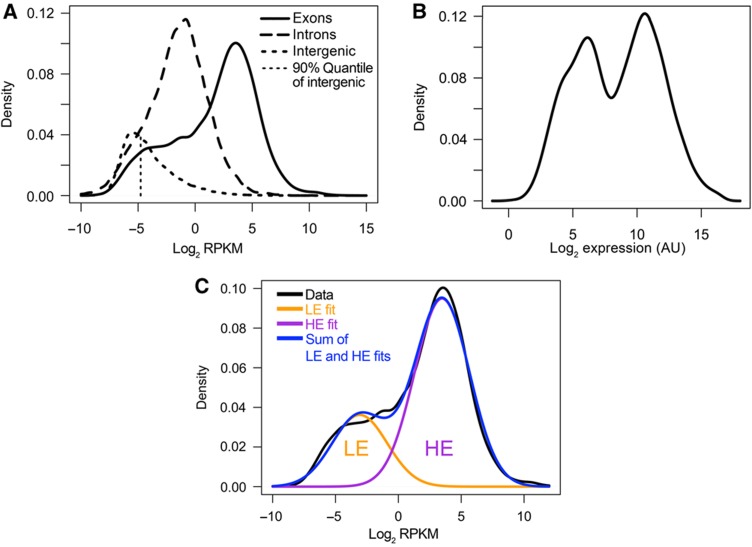
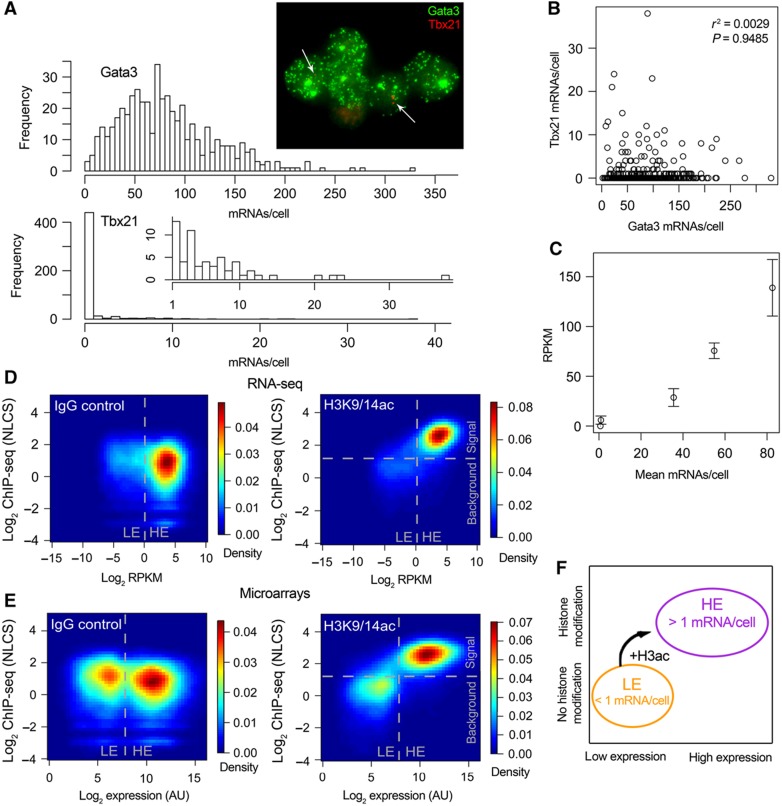
The expression level of a gene is often used as a proxy for determining whether the protein or RNA product is functional in a cell or tissue. Therefore, it is of fundamental importance to understand the global distribution of gene expression levels, and to be able to interpret it mechanistically and functionally. Here we use RNA sequencing (RNA-seq) of mouse Th2 cells, coupled with a range of other techniques, to show that all genes can be separated, based on their expression abundance, into two distinct groups: one group comprised of lowly expressed and putatively non-functional mRNAs, and the other of highly expressed mRNAs with active chromatin marks at their promoters. These observations are confirmed in many other microarray and RNA-seq data sets of metazoan cell types.


Conflict of interest statement

The authors declare that they have no conflict of interest.

Figures

Figure 1
Figure 1
Distribution of gene expression levels. (A) Kernel density estimates of RPKM distributions of RNA-seq data within exons, introns and intergenic regions as indicated. The fragments used to estimate intron and intergenic RPKM were based on randomizations using the same length distribution as the exonic parts of genes. The 90% quantile of the intergenic distribution is indicated. (B) Kernel density estimate of expression level distribution of microarray data (Wei et al, 2009). (C) Expectation-maximization-based curve fitting of RNA-seq data of A.
Figure 2
Figure 2
Sensitivity of RNA-seq. (A) Detection of genes in dependency of the total read numbers on linear scale and log2 scale (inset). Random subsets of the total reads for the two RNA-seq replicates were taken and the number of genes with zero reads were plotted versus the total read numbers used. The figure represents an average of five independent subsets for each data point. (B) Prediction of genes remaining undetected due to Poisson statistics underlying RNA-seq. The theoretically expected fraction of genes remaining undetected (red, y axis on the right side of the figure in red) was determined for each expression level. This was used to infer the expressed genes including the undetected ones (blue) from the actual expression data (black, bins indicated by tick marks across top). In addition to the RPKM scale, the reads per kilobase (RPK) scale (without normalization to the total number of mapped reads) is shown on top, which was used for the calculation of the (integer-) Poisson statistic and which, in contrast to the RPKM scale, depends on the total number of sequencing reads. (C) RT–PCR for the genes are listed in Supplementary Table S1. The RNA-seq expression levels of the genes are plotted versus the negative threshold cycles (Ct) of the PCRs. The plot is overlaid (with the same x axis scaling) upon the kernel density estimate of the RNA-seq expression level distribution (black line) to show the positions of the genes in the total expression distribution. Genes either in the LE peak of the RNA-seq distribution or which have been previously characterized as not expressed in Th2 cells are shown in orange. Genes known to be expressed are shown in purple. Error bars indicate s.e.m. from three independent biological replicates. Please refer to Supplementary Tables S1 and S6 for details of genes and PCR primers. (D) Correlation of RPKM within exons and introns based on the RNA-seq data from Figure 1A. Correlation and significance of correlation were calculated for the whole distribution (gray) or for LE and HE genes separately. Division into LE and HE was performed along a line (white) perpendicular to a fitted trendline (gray), centered at Exon RPKM=1. The data points are shown as 2D kernel density estimate.
Figure 3
Figure 3
(A) Distribution of mRNA numbers among single cells. Histograms for Gata3 and Tbx21 (with an inset histogram starting from 1 instead of 0 to better illustrate higher expressions) and a sample fluorescence microscopy image are shown. Tbx21 transcripts are marked with white arrows to ease identification. (B) Correlation between Gata3 and Tbx21 expression. Correlation coefficient and significance are inset. (C) Plot of mean mRNA numbers per cell versus RNA-seq RPKM of five genes. Error bars indicate s.e.m. from two RNA-seq biological replicates. (D, E) 2D kernel density estimates of gene expression level versus ChIP-seq signal for each gene for RNA-seq (D) and microarray (E) data. Divisions between background and signal for the ChIP-seq component were determined by curve fitting with the software EpiChIP (Hebenstreit et al, 2011) and are indicated. Divisions between LE and HE groups of genes are indicated. (F) Scheme summarizing the results.

References

    1. Akaike H (1974) New look at statistical-model identification. Ieee T Automat Contr Ac 19: 716–723
    1. Boyle EI, Weng S, Gollub J, Jin H, Botstein D, Cherry JM, Sherlock G (2004) GO::TermFinder—open source software for accessing Gene Ontology information and finding significantly enriched Gene Ontology terms associated with a list of genes. Bioinformatics 20: 3710–3715 - PMC - PubMed
    1. Bullard JH, Purdom E, Hansen KD, Dudoit S (2010) Evaluation of statistical methods for normalization and differential expression in mRNA-Seq experiments. BMC Bioinformatics 11: 94. - PMC - PubMed
    1. Casella G, Berger RL (2001) Statistical Inference, 2nd edn. Pacific Grove, CA, USA: Duxbury Press
    1. Chintapalli VR, Wang J, Dow JA (2007) Using FlyAtlas to identify better Drosophila melanogaster models of human disease. Nat Genet 39: 715–720 - PubMed

Publication types