

Epistasis between beneficial mutations and the phenotype-to-fitness Map for a ssDNA virus
- PMID: 21655079
- PMCID: PMC3107187
- DOI: 10.1371/journal.pgen.1002075
Epistasis between beneficial mutations and the phenotype-to-fitness Map for a ssDNA virus
Abstract
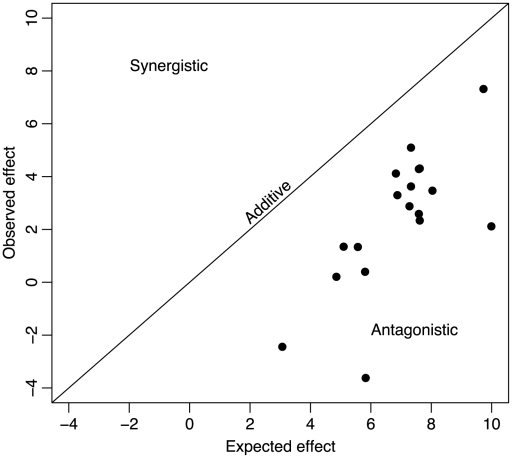
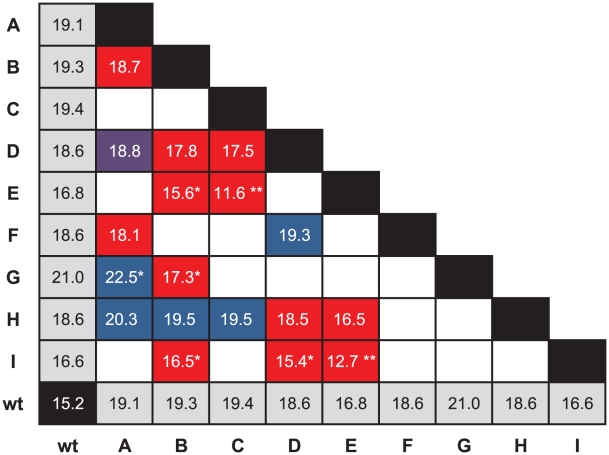
Epistatic interactions between genes and individual mutations are major determinants of the evolutionary properties of genetic systems and have therefore been well documented, but few quantitative data exist on epistatic interactions between beneficial mutations, presumably because such mutations are so much rarer than deleterious ones. We explored epistasis for beneficial mutations by constructing genotypes with pairs of mutations that had been previously identified as beneficial to the ssDNA bacteriophage ID11 and by measuring the effects of these mutations alone and in combination. We constructed 18 of the 36 possible double mutants for the nine available beneficial mutations. We found that epistatic interactions between beneficial mutations were all antagonistic-the effects of the double mutations were less than the sums of the effects of their component single mutations. We found a number of cases of decompensatory interactions, an extreme form of antagonistic epistasis in which the second mutation is actually deleterious in the presence of the first. In the vast majority of cases, recombination uniting two beneficial mutations into the same genome would not be favored by selection, as the recombinant could not outcompete its constituent single mutations. In an attempt to understand these results, we developed a simple model in which the phenotypic effects of mutations are completely additive and epistatic interactions arise as a result of the form of the phenotype-to-fitness mapping. We found that a model with an intermediate phenotypic optimum and additive phenotypic effects provided a good explanation for our data and the observed patterns of epistatic interactions.
Conflict of interest statement
The authors have declared that no competing interests exist.
Figures
 .
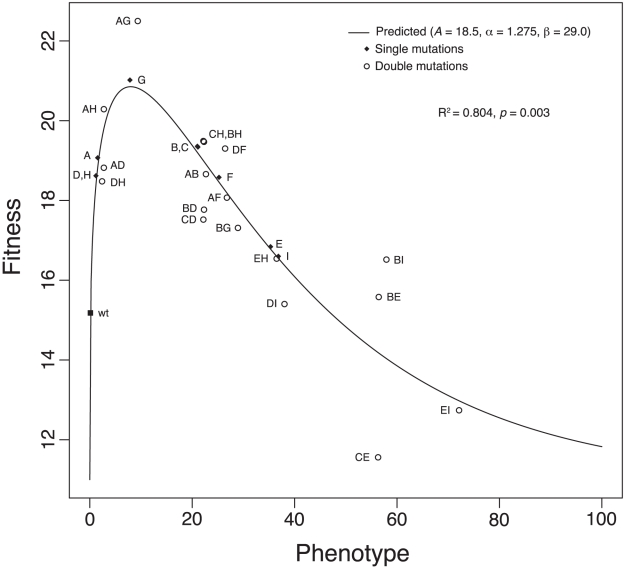
.  gives the coefficient of determination. The
  value is based on an
  test comparing our model to a model assuming that single- and double-mutant fitnesses are independent of each other. For these data,
  . We rescaled fitness by substracting
  rather than the fitness of the wild type to avoid negative values.
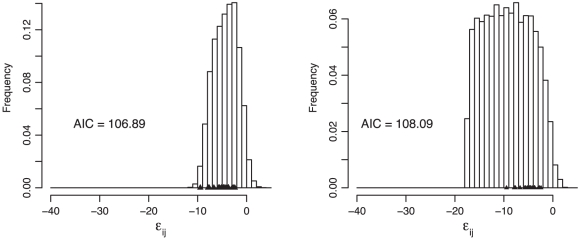
 ; Equation 1) based on simulations under the two models. The observed values are plotted as triangles (Table 3). The gamma model fits the data better by approximately 12 log likelihoods but requires the estimation of 12 more parameters. The Akaike Information Criterion (AIC) scores of the two models are therefore similar, indicating that the two explain the data equally well.
References
-
- Otto SP, Feldman MW. Deleterious mutations, variable epistatic interactions, and the evolution of recombination. Theor Pop Biol. 1997;51:134–147. - PubMed
-
- Otto SP. The evolutionary enigma of sex. Am Nat. 2009;174:S1–S14. - PubMed
-
- Muller HJ. Reversibility in evolution considered from the standpoint of genetics. Biol Rev Cambridge Phil Soc. 1939;14:261–280.
-
- Coyne JA, Orr HA. Speciation. Sunderland (MA): Sinauer Associates; 2004.
Publication types
MeSH terms
Substances
Grants and funding
LinkOut - more resources
Full Text Sources
Other Literature Sources
