. 2011;6(6):e20560.
doi: 10.1371/journal.pone.0020560. Epub 2011 Jun 2.

Inflammatory gene regulatory networks in amnion cells following cytokine stimulation: translational systems approach to modeling human parturition

Affiliations

Inflammatory gene regulatory networks in amnion cells following cytokine stimulation: translational systems approach to modeling human parturition

Ruth Li et al. PLoS One. 2011.

Abstract

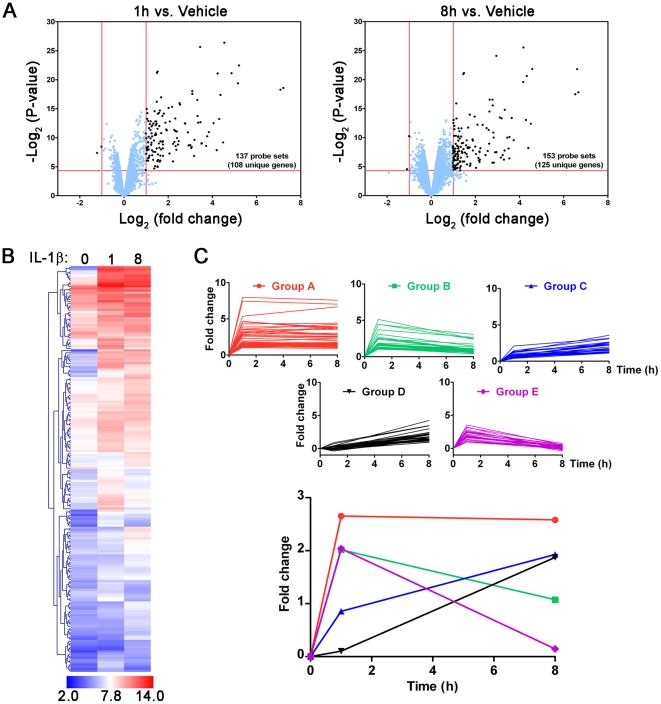
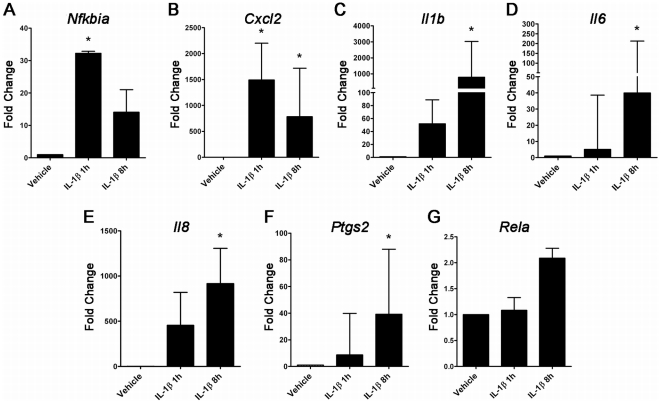
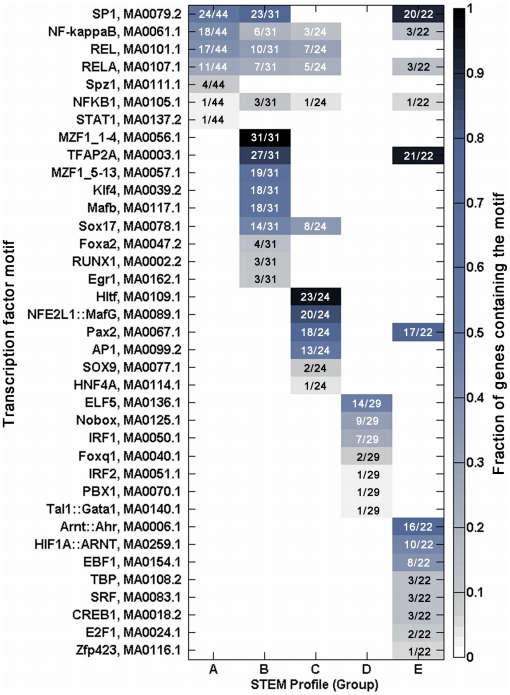
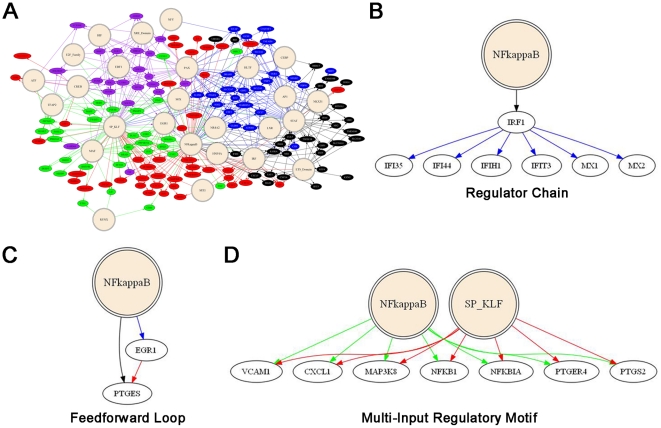
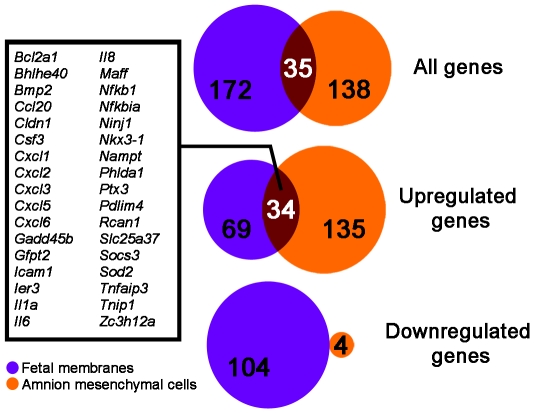
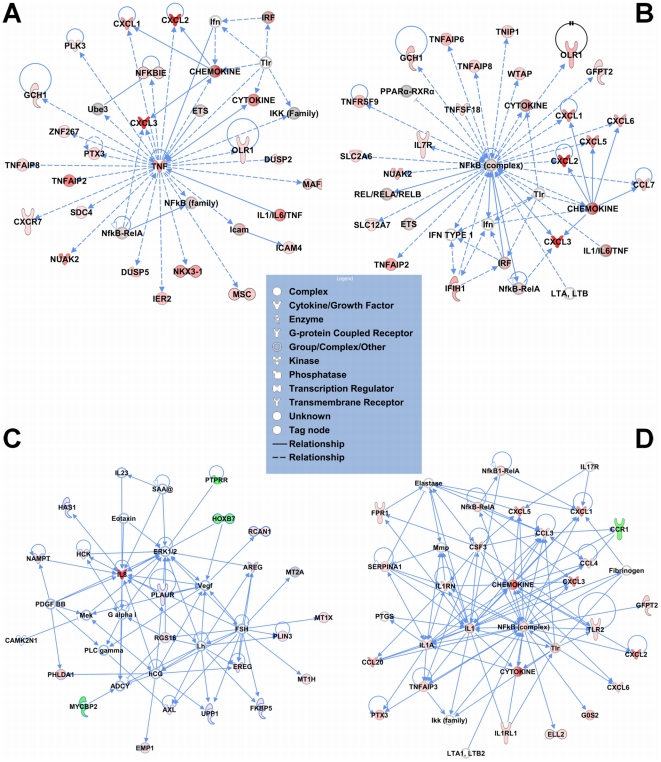
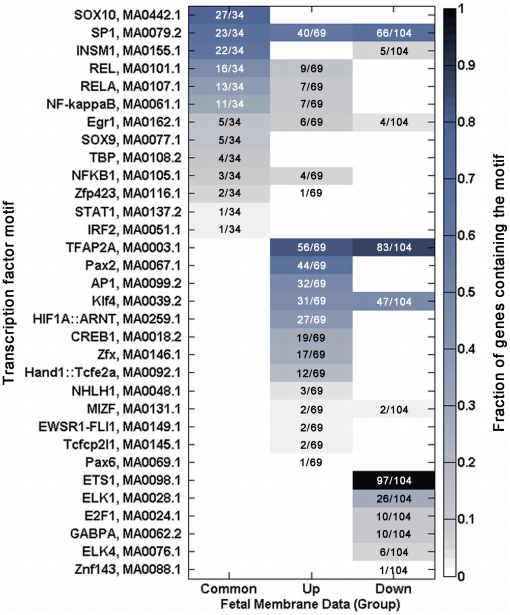
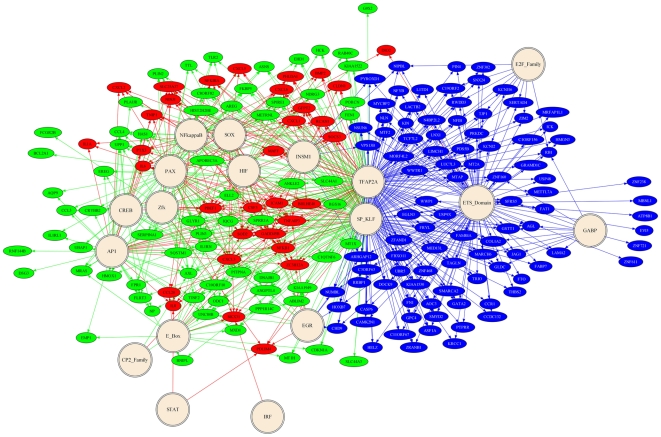
A majority of the studies examining the molecular regulation of human labor have been conducted using single gene approaches. While the technology to produce multi-dimensional datasets is readily available, the means for facile analysis of such data are limited. The objective of this study was to develop a systems approach to infer regulatory mechanisms governing global gene expression in cytokine-challenged cells in vitro, and to apply these methods to predict gene regulatory networks (GRNs) in intrauterine tissues during term parturition. To this end, microarray analysis was applied to human amnion mesenchymal cells (AMCs) stimulated with interleukin-1β, and differentially expressed transcripts were subjected to hierarchical clustering, temporal expression profiling, and motif enrichment analysis, from which a GRN was constructed. These methods were then applied to fetal membrane specimens collected in the absence or presence of spontaneous term labor. Analysis of cytokine-responsive genes in AMCs revealed a sterile immune response signature, with promoters enriched in response elements for several inflammation-associated transcription factors. In comparison to the fetal membrane dataset, there were 34 genes commonly upregulated, many of which were part of an acute inflammation gene expression signature. Binding motifs for nuclear factor-κB were prominent in the gene interaction and regulatory networks for both datasets; however, we found little evidence to support the utilization of pathogen-associated molecular pattern (PAMP) signaling. The tissue specimens were also enriched for transcripts governed by hypoxia-inducible factor. The approach presented here provides an uncomplicated means to infer global relationships among gene clusters involved in cellular responses to labor-associated signals.


Conflict of interest statement

Competing Interests: The authors have declared that no competing interests exist.

Figures

Figure 1
Figure 1. Amnion mesenchymal cell (AMC) microarray data.
(A) Volcano plot showing the criteria (±2.0 no-log fold change, <0.05 p-value) for the filtered (blue points) and unfiltered (black points) AMC microarray data. (B) Hierarchical clustering heatmap of discriminant genes from analysis of AMC microarray data (a complete list of the discriminant genes is found in Table S1). (C) Top significant profiles from temporal expression analysis of the AMC data; the bottom graph shows the average fold change for each profile. Details of the genes that mapped to each temporal profile are found in Table S2.
Figure 2
Figure 2. Microarray data verification using qRT-PCR.
Fold change of the mRNA expression levels of Nfkbia, Cxcl2, Il1b, Il6, Il8, Ptgs2, and Rela in AMC cells treated with 10 ng/ml of IL-1β for 1 h and 8 h and control cells with no IL-1β treatment. Error bars represent standard deviation across at least three independent samples (n = 3 for Rela and Nfkbia, n = 5 for Cxcl2, Il1b, Il6, Il8, and Ptgs2).
Figure 3
Figure 3. Patterns of transcription factor binding motif enrichments within promoters of genes from each temporal expression profile of the AMC data.
Each column in the matrix represents a temporal expression profile, and each row represents a transcription factor binding element. Each profile (column) corresponds to those in Figure 1C, and each colored block in the matrix indicates a pair of motif and temporal expression profile for which a fraction (indicated in the blocks) of the genes in the profile is enriched for the motif (Pscan score of ≥0.95). The color of the blocks corresponds to the fraction of genes in the profile enriched for each transcription factor motif, and corresponds with the color scale shown on the right.
Figure 4
Figure 4. Gene regulatory network of AMC dataset inferred from transcription factor binding motif results.
(A) Overview of gene regulatory network. Double circles represent binding motifs and ovals represent genes. Lines between motifs and genes represent inferred regulation based on Pscan motif analysis. The genes and respective connecting lines are colored based on the STEM profile groups depicted in Figure 1D (group A = red, group B = green, group C = blue, group D = black, group E = purple). (B–D) Types of regulatory subnetworks represented.
Figure 5
Figure 5. Venn diagram of comparing the genes of the AMC and Haddad et al datasets.
The Venn diagrams depict differentially expressed genes from the Haddad et al. data obtained from fetal membranes following term labor, and the genes significantly expressed in AMCs at 1 h and 8 h post IL-1β treatment when compared to control. The diagrams depict the amount of overlap of all the genes, just the upregulated, and the downregulated genes (top to bottom). The inset box lists the 34 genes that are common and upregulated in both the fetal membranes and AMC data. An additional gene, type II iodothyronine deiodinase (Dio2), was common but divergent between the two datasets in that it was downregulated in the fetal membranes while upregulated in AMCs.
Figure 6
Figure 6. Top networks for each time point (1 h and 8 h) in the AMC microarray data and for the Haddad et al. TIL versus TNL microarray data.
(A) The top network of 1h IL-1β treatment of ACC with a score of 44, showing a prominence of TNF and NF-κB family. (B) The top network of 8 h post IL-1β-treatment of ACC with a score of 41. This network shows high connectivity of the relevant genes with the NF-κB family. (C) The top network of the Haddad dataset with a score of 35, showing hormones (FSH, LH, hCG) and growth factors (AREG, EREG, PDGF, VEGF). (D) The second ranking network of the Haddad dataset with a score of 33, showing an inflammatory signature. In the networks, molecules are represented as nodes, and the biological relationship between two nodes is represented as an edge (line). The intensity of the node color indicates the degree of up- (red) or down- (green) regulation. Nodes are displayed using various shapes that represent the functional class of the gene product, as explained in the legend.
Figure 7
Figure 7. Patterns of transcription factor motif enrichments within promoters of genes from the Haddad et al. dataset.
Each column in the matrix represents three clusters of genes: the common upregulated genes between the Haddad et al. and AMC datasets, and the genes uniquely upregulated and downregulated in the Haddad dataset. Each row represents a transcription factor binding element. Each profile (column) corresponds to those in Figure 1C, and each colored block in the matrix indicates a pair of motif and gene cluster for which a fraction (indicated in the blocks) of the genes in the profile is enriched for the motif (Pscan score of ≥0.95). The color of the blocks correspond to the fraction of genes in the profile enriched for each transcription factor binding motif, and corresponds with the color scale shown on the right.
Figure 8
Figure 8. Gene regulatory network of the Haddad et al. dataset inferred from transcription factor binding motif results.
Double circles represent binding motifs and ovals represent genes. Lines between motifs and genes represent inferred regulation based on Pscan motif analysis. The genes and respective connecting lines are colored based on the grouping in Figure 7: common genes with AMC dataset (red), upregulated genes (green), and downregulated genes (blue).

Similar articles

Cited by

References

    1. Challis JR, Lockwood CJ, Myatt L, Norman JE, Strauss JF, III, et al. Inflammation and pregnancy. Reprod Sci. 2009;16:206–215. - PubMed
    1. Keelan JA, Blumenstein M, Helliwell RJ, Sato TA, Marvin KW, et al. Cytokines, prostaglandins and parturition-a review. Placenta. 2003;24(Suppl A):S33–S46. - PubMed
    1. Romero R, Espinoza J, Goncalves LF, Kusanovic JP, Friel LA, et al. Inflammation in preterm and term labour and delivery. Semin Fetal Neonatal Med. 2006;11:317–326. - PMC - PubMed
    1. Heaps BR, House M, Socrate S, Leppert P, Strauss JF., III . Matrix biology and preterm birth. In: Petraglia F, Strauss JF III, Gabbe SG, Weiss G, editors. Preterm birth: mechanisms, mediators, prediction, prevention and interventions. Essex, UK: Informa HealthCare; 2007. pp. 70–93.
    1. Kennard EA, Zimmerman PD, Friedman CI, Kniss DA. Interleukin-1 beta induces cyclooxygenase-2 in cultured human decidual cells. Am J Reprod Immunol. 1995;34:65–71. - PubMed

Publication types

MeSH terms

Associated data