. 2011;6(5):e20362.
doi: 10.1371/journal.pone.0020362. Epub 2011 May 31.

Transcriptional and post-transcriptional mechanisms for oncogenic overexpression of ether à go-go K+ channel

Affiliations

Transcriptional and post-transcriptional mechanisms for oncogenic overexpression of ether à go-go K+ channel

Huixian Lin et al. PLoS One. 2011.

Erratum in

  • PLoS One. 2011;6(11). doi:10.1371/annotation/45b3e6bc-1065-4357-b215-465176dcc269

Abstract

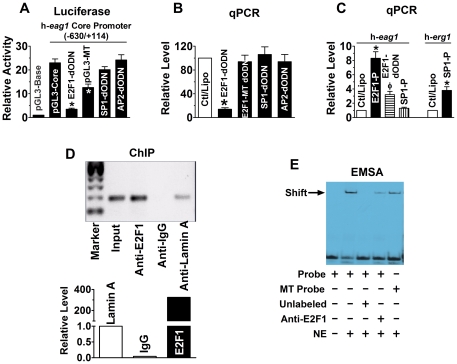
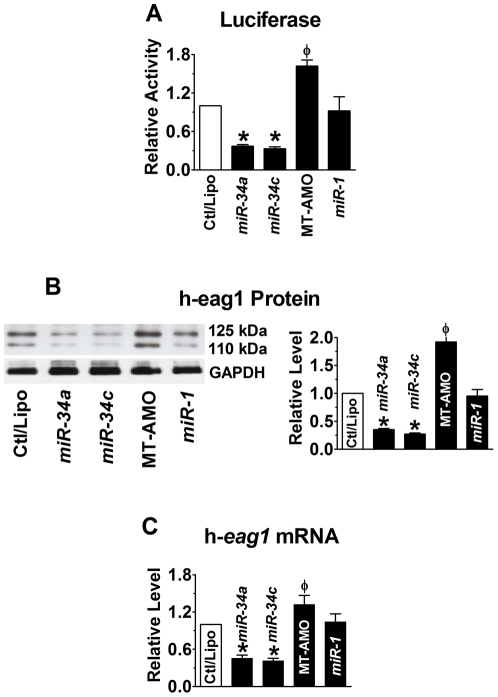
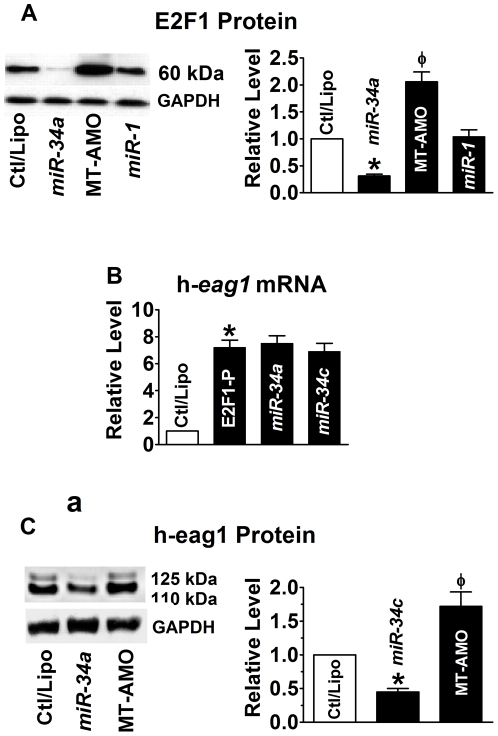
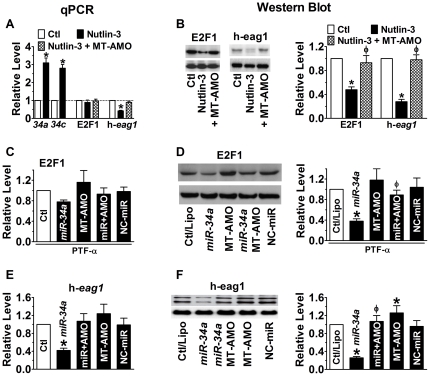
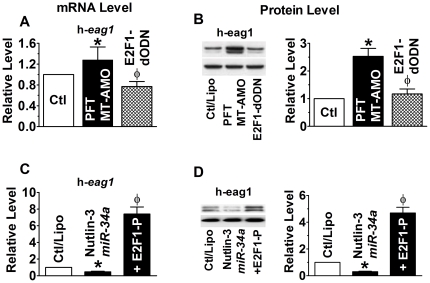
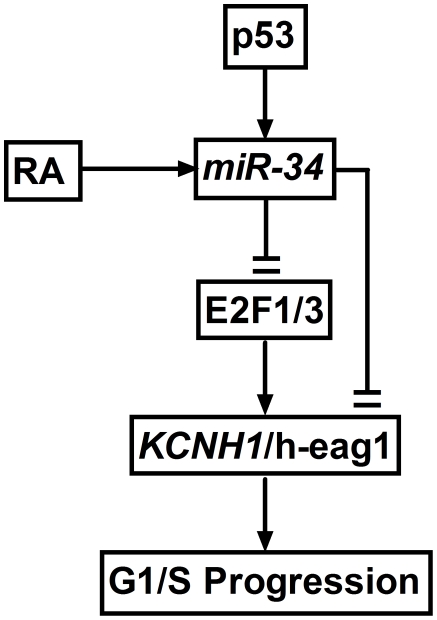
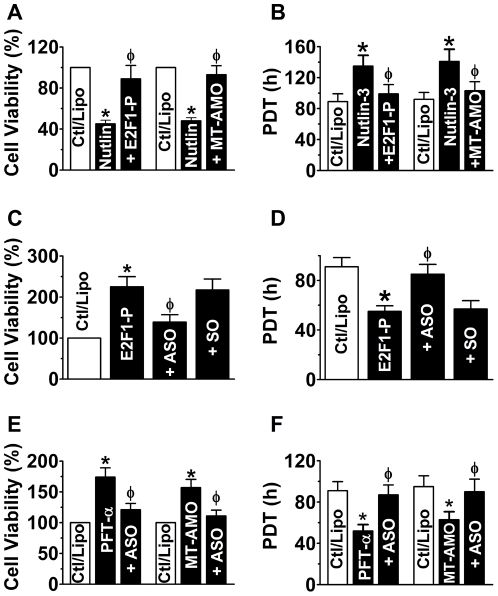
The human ether-à-go-go-1 (h-eag1) K(+) channel is expressed in a variety of cell lines derived from human malignant tumors and in clinical samples of several different cancers, but is otherwise absent in normal tissues. It was found to be necessary for cell cycle progression and tumorigenesis. Specific inhibition of h-eag1 expression leads to inhibition of tumor cell proliferation. We report here that h-eag1 expression is controlled by the p53-miR-34-E2F1 pathway through a negative feed-forward mechanism. We first established E2F1 as a transactivator of h-eag1 gene through characterizing its promoter region. We then revealed that miR-34, a known transcriptional target of p53, is an important negative regulator of h-eag1 through dual mechanisms by directly repressing h-eag1 at the post-transcriptional level and indirectly silencing h-eag1 at the transcriptional level via repressing E2F1. There is a strong inverse relationship between the expression levels of miR-34 and h-eag1 protein. H-eag1antisense antagonized the growth-stimulating effects and the upregulation of h-eag1 expression in SHSY5Y cells, induced by knockdown of miR-34, E2F1 overexpression, or inhibition of p53 activity. Therefore, p53 negatively regulates h-eag1 expression by a negative feed-forward mechanism through the p53-miR-34-E2F1 pathway. Inactivation of p53 activity, as is the case in many cancers, can thus cause oncogenic overexpression of h-eag1 by relieving the negative feed-forward regulation. These findings not only help us understand the molecular mechanisms for oncogenic overexpression of h-eag1 in tumorigenesis but also uncover the cell-cycle regulation through the p53-miR-34-E2F1-h-eag1 pathway. Moreover, these findings place h-eag1 in the p53-miR-34-E2F1-h-eag1 pathway with h-eag as a terminal effecter component and with miR-34 (and E2F1) as a linker between p53 and h-eag1. Our study therefore fills the gap between p53 pathway and its cellular function mediated by h-eag1.


Conflict of interest statement

Competing Interests: The authors have declared that no competing interests exist.

Figures

Figure 1
Figure 1. E2F1 as a transactivator of h-eag1 in SHSY5Y human neuroblastoma cells.
(A) Role of E2F1 in driving the h-eag1 core promoter activity. pGL3-Base: h-eag1 promoter-free pGL3 vector for control; pGL3-Core: pGL3 vector carrying the h-eag1 core promoter (a fragment spanning -630/+114); E2F1-dODN, SP1-dODN, and AP2-dODN: the decoy oligodeoxynucleotides targeting E2F1, SP1, and AP2 transcription factors, respectively, co-transfected with pGL3-Core; pGL3-Mutant: pGL3 vector carrying a mutated h-eag1 core promoter. Transfection was carried out using lipofectamine 2000. *p<0.05 vs pGL3-Core; n = 5 for each group. (B) Changes of h-eag1 mRNA level determined by real-time quantitative RT-PCR (qPCR) in SHSY5Y cells. E2F1-dODN, E2F1-MT dODN, SP1-dODN, or AP2-dODN was transfected alone. Ctl/Lipo: cells mock-treated with lipofectamine 2000; E2F1-MT dODN: the decoy oligodeoxynucleotides targeting E2F1 with mutation at the core region. *p<0.05 vs Ctl/Lipo; n = 5 for each group. (C) Increase in h-eag1 mRNA level by overexpression of E2F1 in SHSY5Y cells transfected with the plasmid expressing the E2F1 gene. E2F1-P: pRcCMV-E2F1 expression vector (Invitrogen), the plasmid carrying the E2F1 cDNA. *p<0.05 vs Ctl/Lipo; n = 5 for each group. (D) Chromatin immunoprecipitation assay (ChIP) assay for the presence of E2F1 on its cis-acting elements in the h-eag1 promoter region in SHSY5Y cells. Left panel: the bands of PCR products of the 5′-flanking region encompassing E2F1 binding sites following immunoprecipitation with the anti-E2F1 antibody or the anti-lamin A antibody for a negative control. Right panel: averaged data on the recovered DNA by anti-E2F1 expressed as fold changes over anti-lamin A band. Input: the input representing genomic DNA prior to immunoprecipitation. (E) Electrophoresis mobility shift assay (EMSA) for the fragment encompassing the putative E2F1 cis-acting element in the h-eag1 promoter region to bind E2F1 protein in the nuclear extract from SHSY5Y cells. Probe: digoxigenin (DIG)-labeled oligonucleotides fragment containing E2F1 binding site; MT Probe: DIG-labeled fragment containing mutated E2F1 site at the core motif; NE: nuclear extract from SHSY5Y cells. Solid arrowhead points to the shifted band representing the DNA-protein complex. Note that the shifted band is weakened by anti-E2F1 antibody or with the mutant E2F1 binding motif.
Figure 2
Figure 2. miR-34 as a post-transcriptional repressor of h-eag1.
(A) Repression of h-eag1 expression by miR-34a or miR-34c, as reported by luciferase activity assay with the pMIR-REPORTTM luciferase miRNA expression reporter vector carrying the h-eag1 3′UTR in HEK293 cells. Ctl: cells transfected with the luciferase vector alone; MT-AMO: the multiple-target anti-miRNA antisense oligonucleotides to miR-34a, miR-34b and miR-34c, co-transfected with the luciferase vector and miR-34a or miR-34c. *p<0.05 vs Ctl/Lipo; φ p<0.05 vs miR-34a; n = 4 for each group. (B) Western blot analysis revealing repression of h-eag1 protein by miR-34a and miR-34c in SHSY5Y cells. *p<0.05 vs Ctl/Lipo; φ p<0.05 vs miR-34a alone; n = 4 for each group. The immunoblot bands shown were run on the same gel. (C) Effect of miR-34 on h-eag1 mRNA level in SHSY5Y cells. *p<0.05 vs Ctl/Lipo; φ p<0.05 vs miR-34a alone; n = 4 for each group.
Figure 3
Figure 3. miR-34 as a post-transcriptional repressor of E2F1.
(A) Effect of miR-34a on E2F1 protein levels in SHSY5Y cells. *p<0.05 vs Ctl/Lipo; φ p<0.05 vs miR-34a alone; n = 6 for each group. (B) Inability of miR-34 to affect the overexpression of h-eag1 mRNA induced by transfection of the plasmid expressing the E2F1 cDNA. *p<0.05 vs Ctl/Lipo; n = 4 for each group. (C) Repression of h = eag1 protein levels by miR-34a in the presence of E1F1 overexpression by the vector containing the E2F1 cDNA. *p<0.05 vs Ctl/Lipo; φ p<0.05 vs miR-34a alone; n = 4 for each group.
Figure 4
Figure 4. Anti-correlation between p53 activity and expression of E2F1 and h-eag1.
(A & B) Effects of p53 activation by Mdm2 inhibitor nutlin-3 (1 µM) on expression of miR-34, E2F1 and h-eag1 at mRNA and protein levels. SHSY5Y cells were pretreated with nutlin-3 and then transfected with MT-AMO. *p<0.05 vs Ctl/Lipo; φ p<0.05 vs Nutlin-3 alone; n = 4 for each group. (C & D) Downregulation of E2F1 at both mRNA and protein levels by miR-34a in the presence of p53 inhibitor Pifithrin-alpha (PFT-α; 30 µM). SHSY5Y cells were pretreated with PFT and then transfected with miR-34a. MT-AMO: an antisense oligomer to miR-34a, miR-34b and miR-34c; miR+AMO: co-transfection of miR-34a and MT-AMO; NC-miR: scrambled negative control miRNA. Control cells were mock-treated with lipofectamine 2000. *p<0.05 vs Ctl/Lipo; φ p<0.05 vs miR-34a alone; n = 4 for each group. (E & F) Downregulation of h-eag1 at both mRNA and protein levels by miR-34a in the presence of p53 inhibitor Pifithrin-alpha (PFT-α; 30 µM). The immunoblot bands shown were run on the same gel. *p<0.05 vs Ctl/Lipo; φ p<0.05 vs miR-34a alone; n = 4 for each group.
Figure 5
Figure 5. Control of h-eag1 expression by E2F1.
(A & B) Effect of E2F1 inhibition by its decoy oligodeoxynucleotides (E2F1-dODN) on h-eag1 expression at both mRNA and protein levels in the presence of both p53 inhibitor and the MT-AMO to miR-34. SHSY5Y cells were pretreated with PFT (30 µM) and MT-AMO and then transfected with E2F1-dODN to sequestrate E2F1. *p<0.05 vs Ctl/Lipo; φ p<0.05 vs PFT+MT-AMO; n = 4 for each group. (C & D) Effect of E2F1 overexpression on h-eag1 expression in the presence of both p53 activator and miR-34a. SHSY5Y cells were pretreated with nutlin-3 (1 µM) and miR-34a and then transfected with the plasmid to overexpress E2F1. *p<0.05 vs Ctl/Lipo; φ p<0.05 vs Nutlin-3+miR-34a; n = 4 for each group.
Figure 6
Figure 6. Proposed model of the p53−miR-34−E2F1−h-eag1 signaling pathway.
RA: retinoic acid, which has been shown to enhance miR-34 expression; E2F1/3: E2F1 and E2F3.
Figure 7
Figure 7. Effects of the p53−miR-34−E2F1−h-eag1 pathway on cell proliferation.
(A & B) Effects of p53 activation by nutlin-3 (1 µM), E2F1 overexpression and miR-34 knockdown on SHSY5Y cell proliferation evaluated with MTT assay (A) and by population doubling time (PDT) with flow cytometry methods (B). Cells were pretreated with nutlin-3 to activate p53 and then transfected with the plasmid carrying E2F1 cDNA for overexpression (E2F1-P) or MT-AMO to knockdown miR-34; control cells (Ctl/Lipo) were mock-treated with lipofectamine 2000. *p<0.05 vs Ctl/Lipo; φ p<0.05 vs Nutlin-3 alone; n = 4 for each group. (C & D) Effect of the antisense oligodeoxynucleotides (ASO) directed against h-eag gene on SHSY5Y cell growth induced by E2F1 overexpression, evaluated with MTT assay (C) and by PDT using flow cytometry methods (D). Cells were transfected with E2F1 plasmid alone (E2F1-P) or co-transfected with E2F1 plasmid and ASO (+ASO) or SO (sense oligomer for negative control; +SO). *p<0.05 vs Ctl/Lipo; φ p<0.05 vs E2F1-P alone; n = 4 for each group. (E & F) Effects of antisense to h-eag1 (ASO) on cell-growth stimulation by PTF-α-induced p53 inactivation in SHSY5Y cells, determined by MTT (E) and by PDT (F). Cells were pretreated with PFT-α (30 µM) to inactivate p53 or transfected with MT-AMO, and then transfected with ASO; control cells (Ctl/Lipo) were mock-treated with lipofectamine 2000. *p<0.05 vs Ctl/Lipo; φ p<0.05 vs PFT-α alone; n = 5 for each group.

References

    1. Pardo LA, Stühmer W. Eag1: an emerging oncological target. Cancer Res. 2008;68:1611–1613. - PubMed
    1. Wang Z. Roles of K+ channels in regulating tumor cell proliferation and apoptosis. Pflugers Arch. 2004;448:274–286. - PubMed
    1. Stühmer W, Alves F, Hartung F, Zientkowska M, Pardo LA. Potassium channels as tumour markers. FEBS Lett. 2006;580:2850–2852. - PubMed
    1. Bauer CK, Schwarz JR. Physiology of EAG K+ channels. J Membr Biol. 2001;182:1–15. - PubMed
    1. Ding XW, Luo HS, Jin X, Yan JJ, Ai YW. Aberrant expression of Eag1 potassium channels in gastric cancer patients and cell lines. Med Oncol. 2007;24:345–350. - PubMed

Publication types

MeSH terms