Comparative Study
. 2011 Aug 1;71(11):1178-88.
doi: 10.1002/pros.21333. Epub 2011 Jan 12.

Prostate-derived Ets transcription factor (PDEF) is a potential prognostic marker in patients with prostate cancer

Affiliations
Comparative Study

Prostate-derived Ets transcription factor (PDEF) is a potential prognostic marker in patients with prostate cancer

Ali Ghadersohi et al. Prostate. .

Abstract

Background: Reduced expression of prostate-derived Ets transcription factor (PDEF) leads to morphologic change as well as increased migration and invasiveness of prostate cancer cells. However, the clinical relevance of PDEF expression and its relationship to anti-apoptotic protein survivin is yet to be determined.

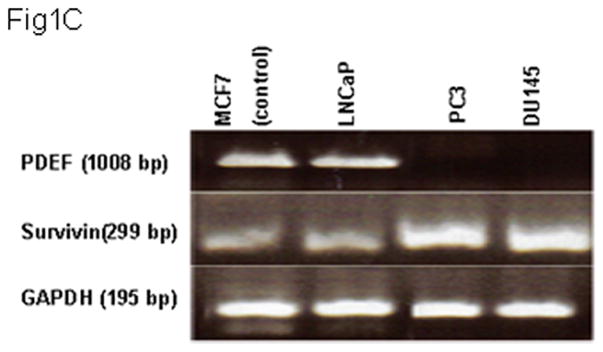
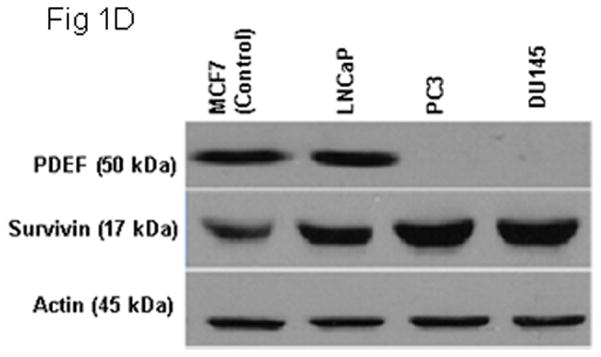
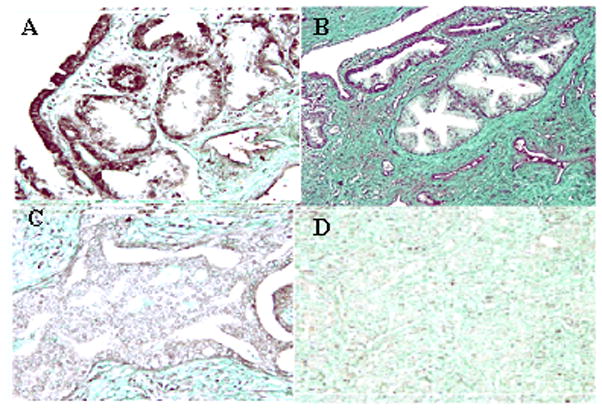
Methods: Tissue microarrays of 73 prostate carcinomas and their adjacent benign prostate tissue, as well as 50 benign prostates were evaluated for PDEF expression by immunohistochemistry. Results were confirmed in available tumor tissues using Western blot and RT-PCR. Expression of survivin in prostate carcinoma and benign tissues were determined using Western blot. Results and correlation with clinical data were statistically analyzed.

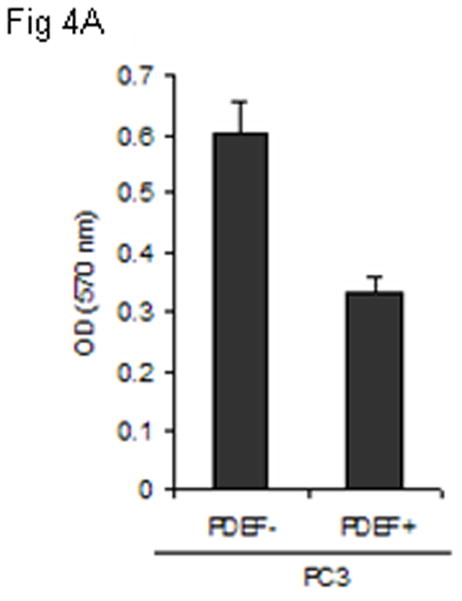
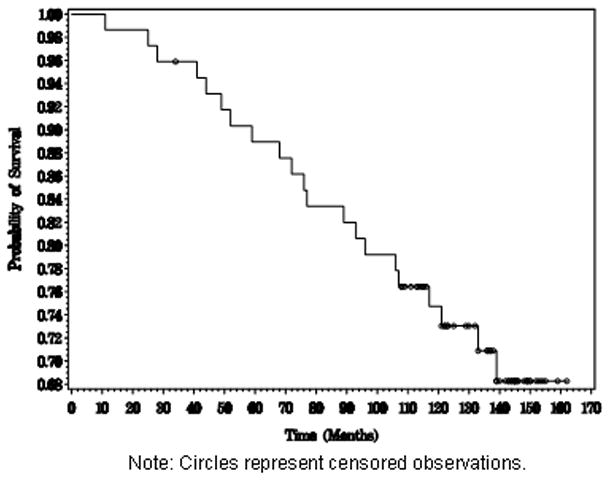
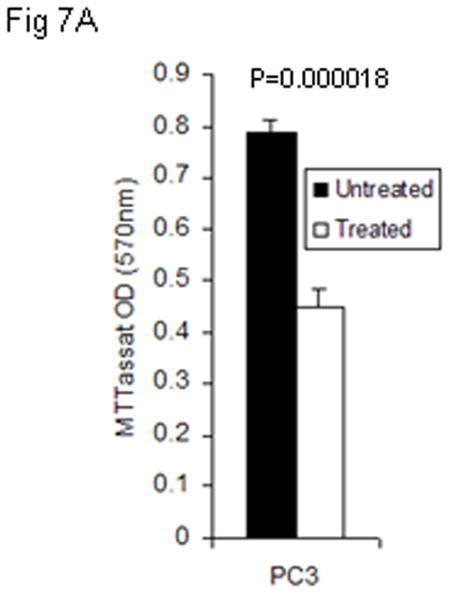
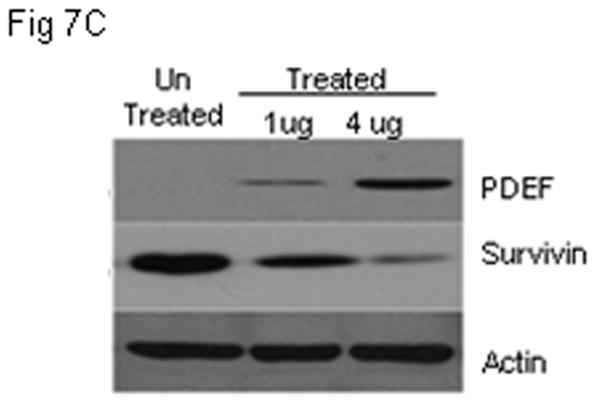
Results: Patients' specimens with low Gleason scores (GS < 5) expressed higher levels of PDEF protein and lower levels of survivin protein when compared with moderate-to-high GS tumors (GS > 6). Patients with PDEF-positive tumor survived significantly longer (P < 0.0001) than patients with PDEF-negative tumor, and the 8-year survival rate was 94% and 40%, respectively. PDEF expression was detected at the highest levels in benign tissues and was down-regulated or lost in 30 recently diagnosed prostate carcinomas. Re-expression of PDEF in prostate cancer cells inhibited survivin expression. Treatment of prostate cancer cells with methylseleninic acid resulted in restoration of PDEF expression, down-regulation of survivin, and inhibition of tumor cell growth when compared with untreated controls (P < 0.05).

Conclusions: These studies demonstrated an inverse correlation between PDEF and survivin expression, and that up-regulation of PDEF was associated with a favorable prognosis in patients with clinically localized prostate cancer.


Figures

Figure 1
Figure 1. Expression of PDEF and survivin in normal and prostate lesions and cell lines
Total RNA and protein lysates were extracted from 10 normal, 30 prostate cancer tissues and cell lines. Samples were analyzed by one-step RT-PCR and western blot, respectively. Panels 1A and 1B are representative images of one-step RT-PCR and western blot, respectively. Samples of prostate tumor tissues were divided into low Gleason score (LGS; n=10), moderate Gleason score (MGS; n=10) and high Gleason score (HGS; n=10). Representative data are presented from triplicate experiment. GAPDH or actin expression was determined as internal controls. Panels 1C and 1D represent results of triplicate experiments of PDEF and survivin expression in multiple prostate cancer cells using one-step RT-PCR and western blot analyses, respectively.
Figure 2
Figure 2. Down-regulation and loss of PDEF expression in prostate cancer lesions compared to normal prostate tissues
Human prostate tissues were subjected to immunohistochemistry (IHC) analysis using rabbit anti-human PDEF antibody. The dark brown color represents positive PDEF staining. Slides were evaluated at 200X original magnifications. PDEF protein expression is reduced or negative in invasive prostate cancer compared with normal prostate tissue. Panel 2A shows a strong nuclear immunoreactivity of PDEF immunohistochemical staining in normal epithelial cells of prostate tissues. Panel 2B is an example of tumor with (LGS) that have high level of PDEF expression. Panel 2C is an example of tumor with (MGS), moderate differentiated infiltrating carcinomas. Panel 2D is an example of tumor with (HGS), poorly differentiated infiltrating carcinomas that show a complete loss of PDEF staining.
Figure 3
Figure 3. Loss of PDEF protein expression in TMA of prostate cancer lesions compared to normal prostate tissues
Human prostate tissue arrays were subjected to IHC analysis. The dark brown color represents PDEF positive staining. Slides were evaluated at 200X original magnifications. PDEF protein expression is reduced or negative in invasive prostate cancer compared with benign prostate tissue. Panel 3A shows a strong nuclear immunoreactivity of PDEF immunohistochemical staining in normal epithelial cells of prostate tissues. Panel 3B is an example of tumor with (LGS) that have high level of PDEF expression. Panel 3C is an example of tumor with (MGS), moderate differentiated infiltrating carcinomas. Panel 3D is an example of tumor with (HGS), poorly differentiated infiltrating carcinomas that show a complete loss of PDEF staining.
Figure 4
Figure 4. Re-expression of PDEF inhibits cell growth, induces apoptosis, down-regulates survivin promoter activity and endogenous survivin expression in a highly invasive PC-3 prostate cancer cell line
Panel 4A: MTT assay performed for the detection of proliferation pcDNA3.1 PDEF PC-3 cells (PDEF+) and mock pcDNA3.1 PC-3 cells (PDEF−). Cell proliferation of PC-3 significantly inhibited (p = 0.000033). Panel 4B: Re-expression of PDEF (using 4 μg pcDNA3.1 PDEF) efficiently inhibited endogenous survivin expression. The relative expression of PDEF and survivin after normalization to GAPDH are shown. Total mRNA extracts were collected 48 hr post-transfection and analyzed by one-step RT-PCR (Qiagen). Panel 4C: Demonstrate the detection of apoptosis in pcDNA3.1 PDEF P11 cells (PDEF+) and mock pcDNA3.1 PC-3 by cell death detection ELISA assay. High level of apoptosis was induced when 4 μg of pcDNA3.1 PDEF vector was used for transfection (p = 0.0094). Panel 4D: Luciferase assay showing that re-expression of PDEF in the PDEF-negative PC-3 prostate cancer cell line significantly decreased survivin promoter-driven luciferase activity. Means ± SD derived from 3 independent assays (p = 0.000013).
Figure 5
Figure 5. The overall survival of prostate cancer patients by PDEF expression
Estimation of the overall survival distribution and the survival distribution of each PDEF group was done using the Kaplan-Meier method.
Figure 6
Figure 6. PDEF expression is associated with longer survival of prostate cancer patients
Kaplan-Meier survival curves for prostate cancer patients with PDEF-positive vs. PDEF-negative tumors are shown. The dotted line represents survival probability for the 53 patients with PDEF-positive tumors and the solid line shows the survival probability for the 20 patients with PDEF-negative tumors. The difference in the survival probability for the two patients groups is highly statistically significant with a P value less than 0.0001.
Figure 7
Figure 7. The effect of MSeA treatment on PDEF and survivin levels in PC-3 cells
Panel 7A shows that re-expression of PDEF in PDEF-negative PC-3 prostate cancer cells after treatment with MSeA. Panel 7B, shows the morphology change of PC-3 cells following 48 hrs treatment with MSeA. Representative images from 3 independent experiments are shown at 200 X magnifications using light microscopy. Panel 7C, shows western blot analysis of re-expressed level of PDEF and down regulated level of survivin after treatment of prostate cancer cells PC-3 with 4μM MSeA. Panel 7D, shows induction of apoptotic cell death after treatments with MSeA. After MSeA treatment, the highest induction of apoptosis level was associated with up regulation of PDEF and down regulation of survivin.

References

    1. Oettgen P, Finger E, Sun Z, Akbarali Y, Thamrongsak U, Boltax J, Grall F, Dube A, Weiss A, Brown L, Quinn G, Kas K, Endress G, Kunsch C, Libermann TA. PDEF, a novel prostate epithelium-specific transcription factor, interacts with the androgen receptor and activates prostate-specific antigen gene expression. J Biol Chem. 2000;275:1216–1225. - PubMed
    1. Moussa O, Turner DP, Feldman RJ, Sementchenko VI, McCarragher BD, Desouki MM, Fraig M, Watson DK. PDEF is a negative regulator of colon cancer cell growth and migration. J Cell Biochem. 2009;108:1389–98. - PMC - PubMed
    1. Kas K, Finger E, Grall F, Gu X, Akbarali Y, Boltax J, Weiss A, Oettgen P, Kapeller R, Libermann TA. ESE-3, a novel member of an epithelium-specific ets transcription factor subfamily, demonstrates different target gene specificity from ESE-1. J Biol Chem. 2000;275:2986–98. - PubMed
    1. Gu X, Zerbini LF, Otu HH, Bhasin M, Yang Q, Joseph MG, Grall F, Onatunde T, Correa RG, Libermann TA. Reduced PDEF expression increases invasion and expression of mesenchymal genes in prostate cancer cells. Cancer Res. 2007;67:4219–4226. - PubMed
    1. Johnson TR, Koul S, Kumar B, Khandrika L, Venezia S, Maron PD, Meacham RB, Koul HK. Loss of PDEF, a prostate-derived Ets factor is associated with aggressive phenotype of prostate cancer: regulation of MMP 9 by PDEF. Mol Cancer. 2010;9:148. - PMC - PubMed

Publication types