

Time series analysis of dengue incidence in Guadeloupe, French West Indies: forecasting models using climate variables as predictors
- PMID: 21658238
- PMCID: PMC3128053
- DOI: 10.1186/1471-2334-11-166
Time series analysis of dengue incidence in Guadeloupe, French West Indies: forecasting models using climate variables as predictors
Abstract
Background: During the last decades, dengue viruses have spread throughout the Americas region, with an increase in the number of severe forms of dengue. The surveillance system in Guadeloupe (French West Indies) is currently operational for the detection of early outbreaks of dengue. The goal of the study was to improve this surveillance system by assessing a modelling tool to predict the occurrence of dengue epidemics few months ahead and thus to help an efficient dengue control.
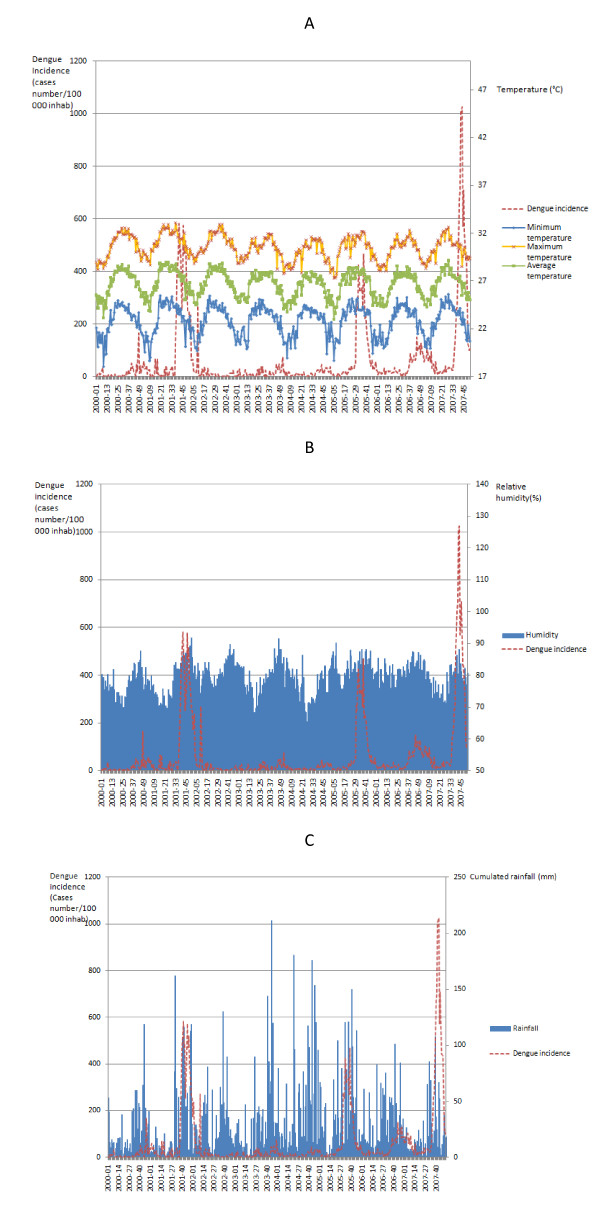
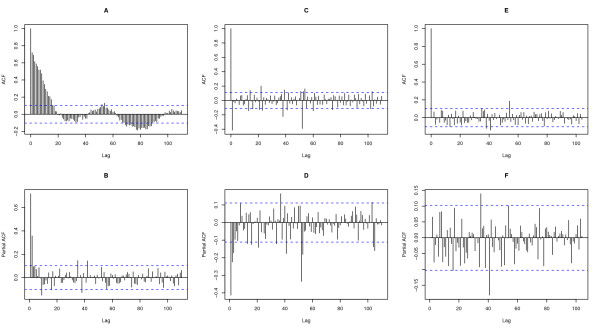
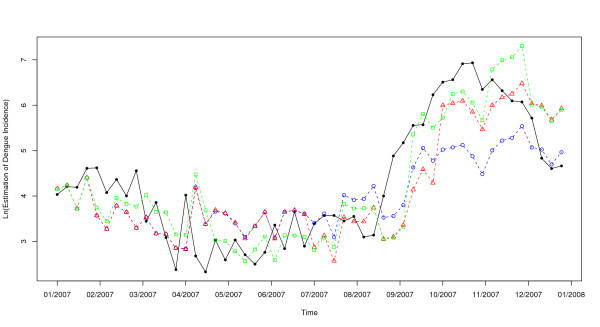
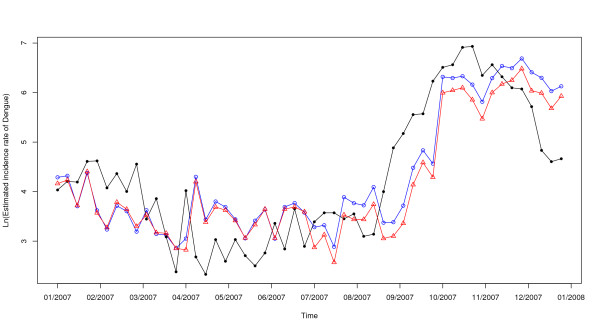
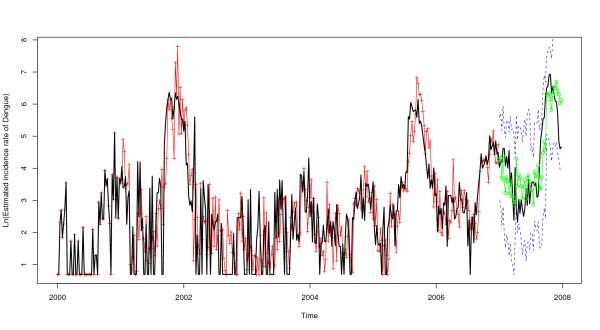
Methods: The Box-Jenkins approach allowed us to fit a Seasonal Autoregressive Integrated Moving Average (SARIMA) model of dengue incidence from 2000 to 2006 using clinical suspected cases. Then, this model was used for calculating dengue incidence for the year 2007 compared with observed data, using three different approaches: 1 year-ahead, 3 months-ahead and 1 month-ahead. Finally, we assessed the impact of meteorological variables (rainfall, temperature and relative humidity) on the prediction of dengue incidence and outbreaks, incorporating them in the model fitting the best.
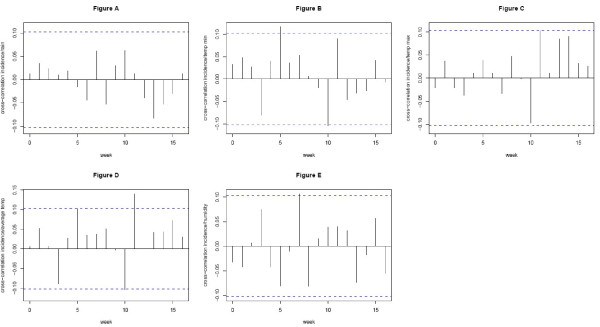
Results: The 3 months-ahead approach was the most appropriate for an effective and operational public health response, and the most accurate (Root Mean Square Error, RMSE = 0.85). Relative humidity at lag-7 weeks, minimum temperature at lag-5 weeks and average temperature at lag-11 weeks were variables the most positively correlated to dengue incidence in Guadeloupe, meanwhile rainfall was not. The predictive power of SARIMA models was enhanced by the inclusion of climatic variables as external regressors to forecast the year 2007. Temperature significantly affected the model for better dengue incidence forecasting (p-value = 0.03 for minimum temperature lag-5, p-value = 0.02 for average temperature lag-11) but not humidity. Minimum temperature at lag-5 weeks was the best climatic variable for predicting dengue outbreaks (RMSE = 0.72).
Conclusion: Temperature improves dengue outbreaks forecasts better than humidity and rainfall. SARIMA models using climatic data as independent variables could be easily incorporated into an early (3 months-ahead) and reliably monitoring system of dengue outbreaks. This approach which is practicable for a surveillance system has public health implications in helping the prediction of dengue epidemic and therefore the timely appropriate and efficient implementation of prevention activities.
Figures
References
-
- World Health Organisation. Dengue. Guidelines for diagnosis, treatment, prevention and control. New Edition; 2009. http://whqlibdoc.who.int/publications/2009/9789241547871_eng.pdf - PubMed
-
- Gubler DJ. Dengue/dengue haemorrhagic fever: history and current status. Novartis Found Symp. 2006;277:3–16. - PubMed
-
- World Health Organization. Asia-Pacific dengue program managers meeting. Manila Western Pacific Region; 2008. http://www.wpro.who.int/internet/files/mvp/Dengue_Report.pdf
