. 2011 Aug 5;411(1):158-73.
doi: 10.1016/j.jmb.2011.05.030. Epub 2011 May 30.

Dynamic Interaction of Hsp90 with Its Client Protein p53

Affiliations

Dynamic Interaction of Hsp90 with Its Client Protein p53

Sung Jean Park et al. J Mol Biol. .

Abstract

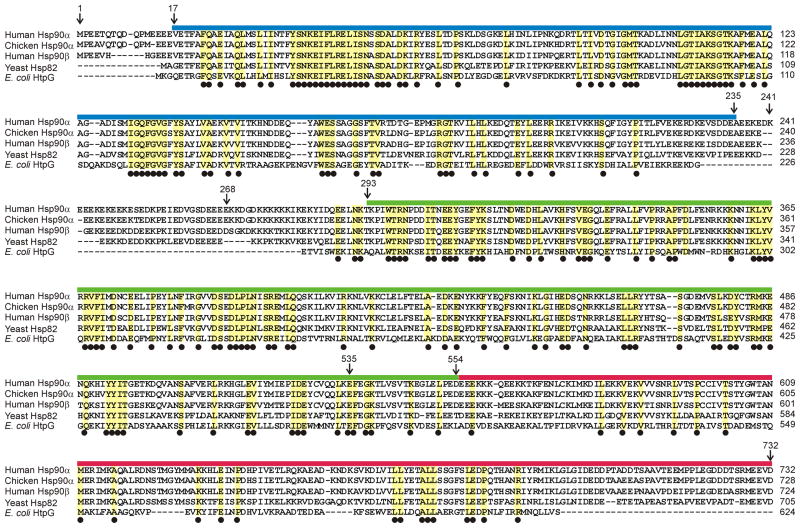
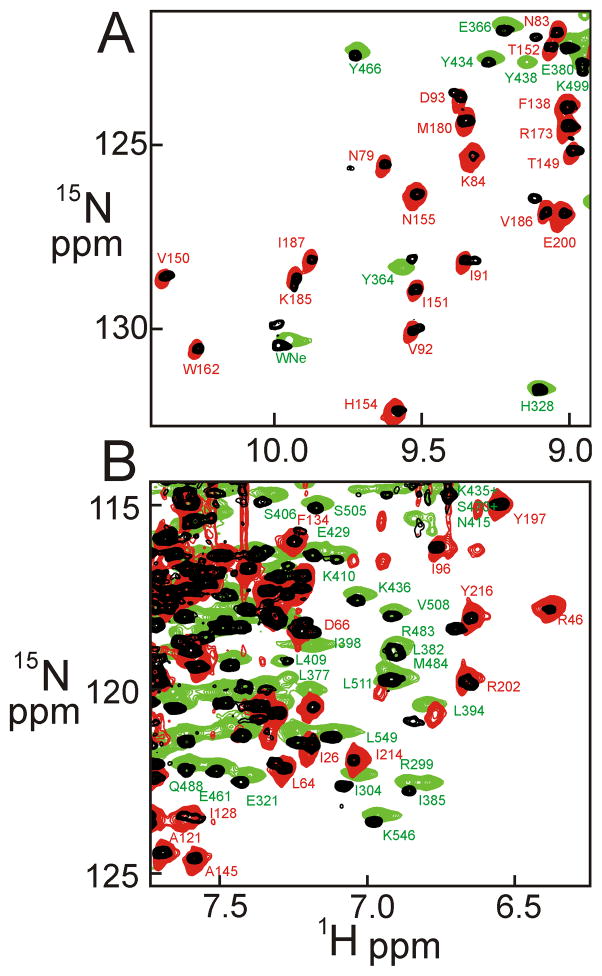
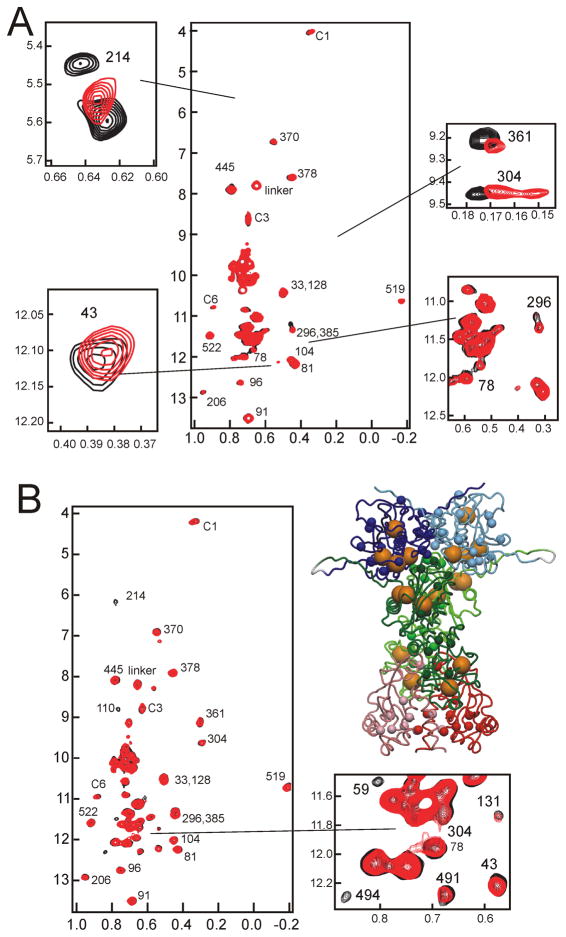
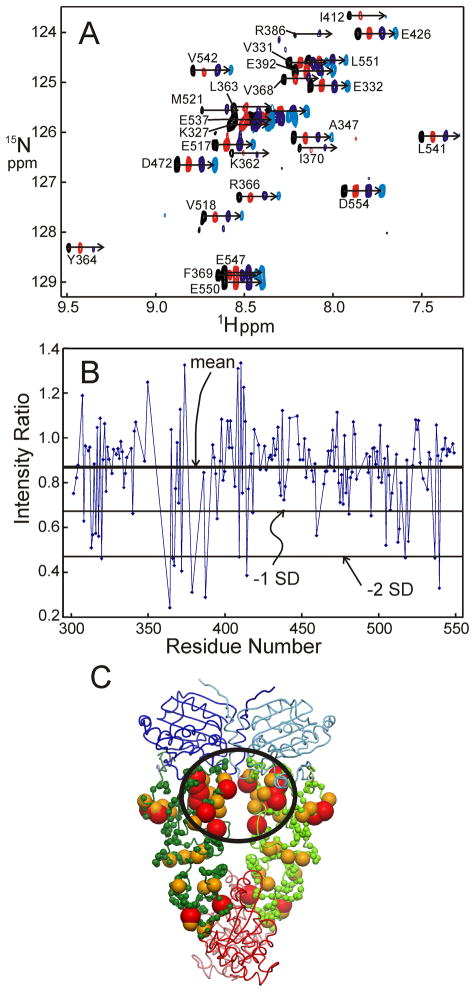
Although the structure of the molecular chaperone Hsp90 has been extensively characterized by X-ray crystallography, the nature of the interactions between Hsp90 and its client proteins remains unclear. We present results from a series of spectroscopic studies that strongly suggest that these interactions are highly dynamic in solution. Extensive NMR assignments have been made for human Hsp90 through the use of specific isotopic labeling of one- and two-domain constructs. Sites of interaction of a client protein, the p53 DNA-binding domain, were then probed both by chemical shift mapping and by saturation transfer NMR spectroscopy. Specific spectroscopic changes were small and difficult to observe, but were reproducibly measured for residues over a wide area of the Hsp90 surface in the N-terminal, middle and C-terminal domains. A somewhat greater specificity, for the area close to the interface between the N-terminal and middle domains of Hsp90, was identified in saturation transfer experiments. These results are consistent with a highly dynamic and nonspecific interaction between Hsp90 and p53 DNA-binding domain in this chaperone-client system, which results in changes in the client protein structure that are detectable by spectroscopic and other methods.


Figures

Figure 1
Figure 1
A. Domain structure of human Hsp90α showing domain boundaries used to design the constructs used in this study. B. Ribbon diagram of the X-ray crystal structure of dimeric yeast Hsp82, from the complex with Sba1. Ribbon colors correspond to the domain boundaries delineated in part A, and one monomer unit is shown in light colors, the other in darker shades of the same colors. The Sba1 backbone has been omitted for clarity. The figure was prepared using Molmol.
Figure 2
Figure 2
Amino acid sequence alignment of Homo sapiens Hsp90α, Gallus gallus Hsp90α, Homo sapiens Hsp90β, Saccharomyces cerevisiae Hsp82 and Escherichia coli HtpG. The location of the N-terminal (N), middle (M) and C-terminal (C) domains are indicated by colored bars corresponding to those of Figure 1A. Residues identical among the four species are outlined in yellow and have a black dot beneath. Residue numbers at the boundaries of the domains correspond to the human Hsp90α sequence used in the present study.
Figure 3
Figure 3
A and B. Two regions of a superposition of the 1H-15N TROSY-HSQC spectra of the single-domain constructs N (red; 800 MHz) and M (green; 900 MHz), with that of the two-domain construct NM (black; 900 MHz), showing the correspondence of many of the cross peaks. Selected assigned cross peaks are labeled.
Figure 4
Figure 4
Assignment of methyl spectra of Hsp90 from those of the constituent domains. A. Superposition of the 900 MHz 1H-13C TROSY-HMQC spectra of Hsp90Δ (black) with that of N (blue). B. Superposition of the 900 MHz 1H-13C TROSY-HMQC spectra of Hsp90Δ (black) with that of M (green). C. Superposition of the 900 MHz 1H-13C TROSY-HMQC spectra of Hsp90Δ (black) with that of C (red). The Ile CδH3 cross peaks for C are unassigned, but are labeled to show that there are 11 present, as expected from the amino acid sequence. D. Superposition of the 900 MHz 1H-13C TROSY-HMQC spectra of Hsp90Δ (black) with that of NM (turquoise). Cross peaks are labeled with residue numbers corresponding to those of the N and M spectra of parts A and B. Cross peaks in the NM spectrum that appear in neither the N nor M spectra are presumed to correspond with the 3 Ile residues in the linker between N and M. (Inset) superposition of spectra of NM (black), N (blue) and Hsp90Δ (red), plotted at a lower contour level than for the main spectrum, showing the two positions for the I214 cross peak. E. Superposition of the 900 MHz 1H-13C TROSY-HMQC spectra of Hsp90Δ (black) with that of M (orange). Cross peaks corresponding to assigned resonances of M are labeled with residue numbers, while the 11 unassigned cross peaks of the C domain are numbered as in part C.
Figure 5
Figure 5
Addition of the ATP analog AMP-PNP to N. A. Superposition of 500 MHz 1H-13C TROSY-HMQC spectra of N (black) with added mole ratios of AMP-PMP of 1:2 (red), 1:6 (green), 1:9 (magenta), 1:16 (blue). Residues with significant change are numbered in red, with smaller change in orange, and little or no change in black, with arrows denoting the direction of the change. B. Ribbon diagram of the structure of the N-terminal domain of yeast Hsp90 in complex with ADP , showing the ADP in blue. The locations of the isoleucine residues are indicated by spheres centered on the backbone nitrogen atom for clarity, and the residues are labeled according to the data shown in part A. Green and yellow spheres represent residues with small (yellow) or no (green) shifts upon addition of AMP-PNP. C. Superposition of 800 MHz 1H-13C TROSY-HMQC spectra of Hsp90Δ (100 μM, pH 6.7) (black) and in the presence of 3.6 mM AMP-PNP (red). Cross peaks corresponding to the resonances that move significantly in the N-terminal domain are labeled by analogy with the results shown in part A.
Figure 6
Figure 6
Superposition of 900 MHz 1H-13C TROSY-HMQC spectra of Ile methyl resonances upon addition of p53 DBD. A. NM (black, 70 μM) and after addition of p53 DBD (red, 210 μM) at 10°C. Small surrounding panels show enlarged portions of the spectrum at lower contour levels. The inset structure shows a portion of the of the X-ray crystal structure of dimeric yeast Hsp82, identified with the equivalent residues of yeast Hsp82 using the sequence alignment in Figure 2. The small colored spheres show the location of the isoleucine Cδ atoms, color coded according to their position in the N and M domains, with the locations of the residues identified in the three enlarged spectra shown in orange. B. MC (black, 50 μM) and after addition of p53 DBD (red, 150 μM) at 10°C. Small surrounding panels show enlarged portions of the spectrum at lower contour levels. The inset structure shows a portion of the of the X-ray crystal structure of dimeric yeast Hsp82, identified with the equivalent residues of yeast Hsp82 using the sequence alignment in Figure 2. The small colored spheres show the location of the isoleucine Cδ atoms, color coded according to their position in the M and C domains, with lighter colors for one monomeric unit and darker colors for the other. The locations of the residues identified in the enlarged spectra are shown in orange.
Figure 7
Figure 7
Superposition of 900 MHz 1H-13C TROSY-HMQC spectra of Ile methyl resonances of Hsp90Δ upon addition of p53 DBD at two temperatures. A. Hsp90Δ (black, 52 μM) and after addition of p53 DBD (red, 100 μM) at 10°C. Small surrounding panels show enlarged portions of the spectrum at lower contour levels. B. Hsp90Δ (black, 40 μM) and after addition of p53 DBD (red, 120 μM) at 25°C. The small panel shows an enlarged portion of the spectrum at the same contour level. The inset structure shows a portion of the of the X-ray crystal structure of dimeric yeast Hsp82, orange spheres show the residues affected by p53 addition, identified with the equivalent residues of yeast Hsp82 using the sequence alignment in Figure 2. The small colored spheres show the location of the isoleucine Cδ atoms, color coded according to their position in the N, M and C domains, with lighter colors for one monomeric unit and darker colors for the other. The locations of the residues identified in the enlarged spectra of both parts A and B shown in orange.
Figure 8
Figure 8
A. Overlay of four HSQC spectra (portion) showing the results of the saturation transfer experiments. For each residue, cross peaks for the free M domain with no saturation (black), free M domain with saturation in the aliphatic region (red), M domain in complex with p53 with no saturation (dark blue) and M domain in complex with p53 with saturation of the aliphatic protons (light blue) are shown offset for clarity. The scale at the bottom of the figure refers to the 1H chemical shifts of the black spectrum. B. Attenuation of measured peak volume by saturation transfer plotted per residue according to the sequence of human Hsp90 M domain. The values are obtained from the calculation: [volume(M+p53)sat/volume(M+p53)unsat]/[volume(M)sat/volume(M)unsat] for each cross peak that could be adequately resolved in the spectrum. The cutoff for the red and orange colored spheres in part C are shown for residues with volume ratios < (mean − 2 × SD) (red) and with volume ratios < (mean − 1 × SD) (orange). The mean value of the volume ratio calculated from a total of 174 resolved cross peaks was 0.86, with a standard deviation of 0.20. C. Mapping of contact points on the M domain identified by the saturation transfer data onto the structure of yeast Hsp82. Positions of backbone nitrogen atoms of residues where the N-H cross peak was significantly more attenuated for the complex, compared with the free protein are shown as spheres. The residues attenuated by saturation in the M domain of human Hsp90 (as measured in this work) were identified with the equivalent residues of yeast Hsp82 using the sequence alignment in Figure 2. The figure was prepared using Molmol.

References

    1. Young JC, Agashe VR, Siegers K, Hartl FU. Pathways of chaperone-mediated protein folding in the cytosol. Nat Rev Mol Cell Biol. 2004;5:781–791. - PubMed
    1. Wegele H, Muller L, Buchner J. Hsp70 and Hsp90--a relay team for protein folding. Rev Physiol Biochem Pharmacol. 2004;151:1–44. - PubMed
    1. Hundley HA, Walter W, Bairstow S, Craig EA. Human Mpp11 J protein: ribosome-tethered molecular chaperones are ubiquitous. Science. 2005;308:1032–1034. - PubMed
    1. Pratt WB, Toft DO. Steroid receptor interactions with heat shock protein and immunophilin chaperones. Endocr Rev. 1997;18:306–360. - PubMed
    1. Richter K, Buchner J. Hsp90: chaperoning signal transduction. J Cell Physiol. 2001;188:281–290. - PubMed

Publication types

MeSH terms

Substances