. 2012 Feb;22(2):271-82.
doi: 10.1101/gr.117523.110. Epub 2011 Jun 9.

Genome-scale analysis of aberrant DNA methylation in colorectal cancer

Affiliations

Genome-scale analysis of aberrant DNA methylation in colorectal cancer

Toshinori Hinoue et al. Genome Res. 2012 Feb.

Abstract

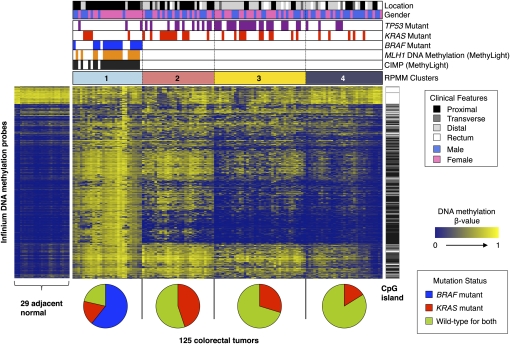
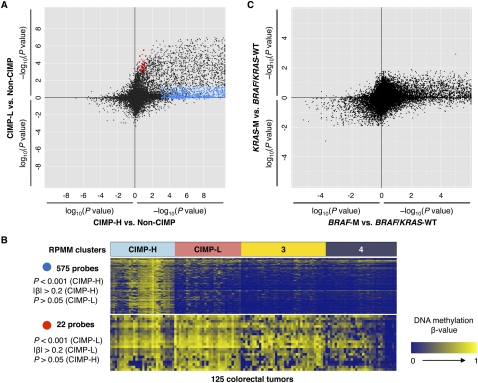
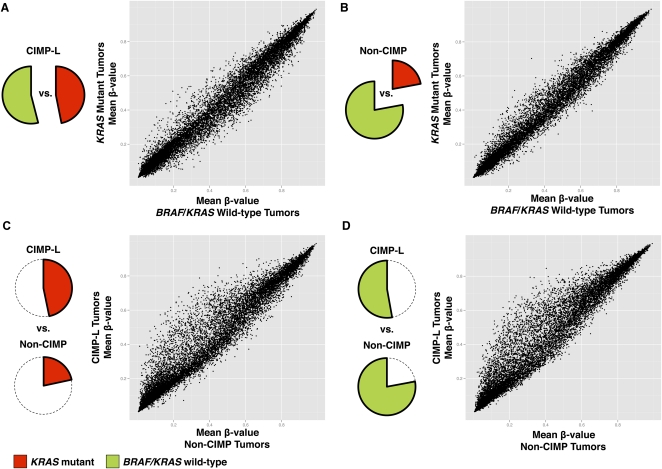
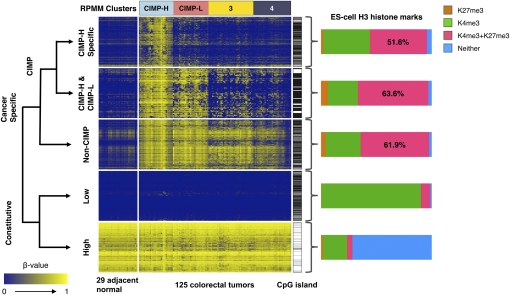
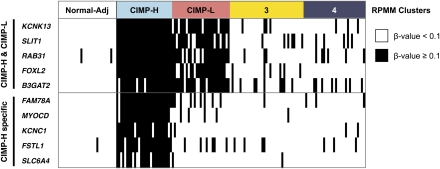
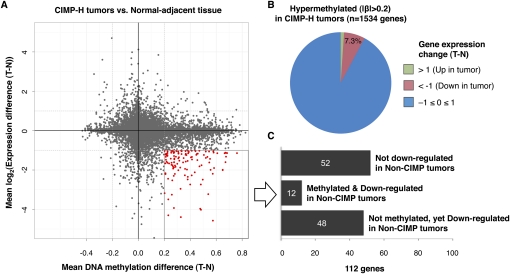
Colorectal cancer (CRC) is a heterogeneous disease in which unique subtypes are characterized by distinct genetic and epigenetic alterations. Here we performed comprehensive genome-scale DNA methylation profiling of 125 colorectal tumors and 29 adjacent normal tissues. We identified four DNA methylation-based subgroups of CRC using model-based cluster analyses. Each subtype shows characteristic genetic and clinical features, indicating that they represent biologically distinct subgroups. A CIMP-high (CIMP-H) subgroup, which exhibits an exceptionally high frequency of cancer-specific DNA hypermethylation, is strongly associated with MLH1 DNA hypermethylation and the BRAF(V600E) mutation. A CIMP-low (CIMP-L) subgroup is enriched for KRAS mutations and characterized by DNA hypermethylation of a subset of CIMP-H-associated markers rather than a unique group of CpG islands. Non-CIMP tumors are separated into two distinct clusters. One non-CIMP subgroup is distinguished by a significantly higher frequency of TP53 mutations and frequent occurrence in the distal colon, while the tumors that belong to the fourth group exhibit a low frequency of both cancer-specific DNA hypermethylation and gene mutations and are significantly enriched for rectal tumors. Furthermore, we identified 112 genes that were down-regulated more than twofold in CIMP-H tumors together with promoter DNA hypermethylation. These represent ∼7% of genes that acquired promoter DNA methylation in CIMP-H tumors. Intriguingly, 48/112 genes were also transcriptionally down-regulated in non-CIMP subgroups, but this was not attributable to promoter DNA hypermethylation. Together, we identified four distinct DNA methylation subgroups of CRC and provided novel insight regarding the role of CIMP-specific DNA hypermethylation in gene silencing.


Figures

Figure 1.
Figure 1.
RPMM-based classification of 125 colorectal tumor samples and heatmap representation of Infinium DNA methylation data. DNA methylation profiles of 1401 probes with most variable DNA methylation values (standard deviation >0.20) in the 125 colorectal tumor sample set. The DNA methylation β-values are represented by using a color scale from dark blue (low DNA methylation) to yellow (high DNA methylation). Four subgroups were derived by RPMM-based clustering and are indicated above the heatmap: (light sky blue) cluster 1 (n = 28); (light coral) cluster 2 (n = 29); (yellow) cluster 3 (n = 37); (dark gray) cluster 4 (n = 31). (Black bars) CIMP-positive tumors as classified by the MethyLight five-marker panel (Weisenberger et al. 2006). Presence of MLH1 DNA methylation (orange bars), BRAF mutation (blue bars), KRAS mutation (red bars), and TP53 mutations (purple bars). Probes that are located within CpG islands (Takai-Jones) (Takai and Jones 2002) are indicated by the horizontal black bars to the right of the heatmap. The probes are arranged based on the order of unsupervised hierarchal cluster analysis using a correlation distance metric and average linkage method. Pie charts below the heatmap show the proportion of tumor samples harboring BRAF mutations (blue), KRAS mutations (red), and those that are wild-type for both BRAF and KRAS (yellow-green) within each subgroup.
Figure 2.
Figure 2.
DNA methylation characteristics associated with CIMP-H, CIMP-L, BRAF-, and KRAS mutant colorectal tumors. (A) Comparison of CIMP-H- and CIMP-L-associated DNA methylation profiles. Each data point represents the log10-transformed FDR-adjusted P-value comparing DNA methylation in CIMP-H (n = 28) versus non-CIMP tumors (n = 68) (x-axis) and in CIMP-L (n = 29) versus non-CIMP tumors (n = 68) (y-axis) for each Infinium DNA methylation probe. For the probes with higher mean DNA methylation in CIMP-H or CIMP-L tumors compared to non-CIMP tumors, −1 is multiplied by log10(FDR-adjusted P-value), providing positive values. The blue and red points highlight probes that are significantly hypermethylated in CIMP-H and CIMP-L tumors compared to non-CIMP tumors, respectively. (B) Heatmap representing Infinium DNA methylation β-values for 575 CpG sites that are significantly hypermethylated in CIMP-H compared with non-CIMP tumors (top) and 22 CpG sites that are significantly hypermethylated in CIMP-L compared with non-CIMP tumors (bottom). The four DNA methylation-based subgroups are indicated above the heatmaps. A color gradient from dark blue to yellow was used to represent the low and high DNA methylation β-values, respectively. (C) Comparison of BRAF mutant- and KRAS mutant-associated DNA hypermethylation signatures in CRC. The log10-transformed FDR-adjusted P-value for each probe is plotted for tumors harboring KRAS mutations (KRAS-M) (n = 34) versus BRAF/KRAS wild-type (n = 74) (y-axis) and those containing BRAF mutations (BRAF-M) (n = 17) versus BRAF/KRAS wild-type (n = 74) (x-axis). For the probes with higher mean DNA methylation β-values in BRAF or KRAS mutant tumors compared to wild-type tumors, −1 is multiplied by log10(FDR-adjusted P-value), providing positive values.
Figure 3.
Figure 3.
CIMP-L-associated DNA hypermethylation occurs independent of KRAS mutation status in CRC. CIMP-L and non-CIMP tumors were subdivided by their KRAS and BRAF mutation status (KRAS mutant or BRAF/KRAS wild-type), and mean DNA methylation β-values were compared between each group. Scatterplots comparing mean DNA methylation β-values between (A) KRAS mutant and BRAF/KRAS wild-type tumors within the CIMP-L subgroup; (B) KRAS mutant and BRAF/KRAS wild-type tumors within the non-CIMP subgroups; (C) KRAS mutant, CIMP-L tumors versus KRAS mutant, non-CIMP tumors; and (D) BRAF/KRAS wild-type, CIMP-L tumors compared with non-CIMP tumors with the same genotype.
Figure 4.
Figure 4.
ES-cell histone marks associated with genes in the five classification groups described in the text. Shown are heatmap representations of DNA methylation β-values for unique gene promoters that belong to five different categories: (1) CIMP-H specific: CIMP-associated DNA methylation markers specific for the CIMP-H subgroup only (n = 415 genes); (2) CIMP-H & CIMP-L: CIMP-specific DNA methylation shared between the CIMP-H and CIMP-L subgroups (n = 73 genes); (3) Non-CIMP: Cancer-specific DNA methylation but outside of the CIMP context (n = 547 genes); (4) Constitutive-Low: Constitutively unmethylated genes in both tumor and adjacent normal tissue samples (n = 500 genes); (5) Constitutive-High: Constitutively methylated in both tumor and adjacent normal tissue samples (n = 500 genes). Genes containing CpG islands defined by Takai and Jones (2002) are indicated by horizontal black bars immediately to the right of each heatmap. The bar charts to the right of each heatmap show the proportion of gene promoters with occupancy of histone H3 lysine 4 trimethylation (K4me3) and/or histone H3 lysine 27 trimethylation (K27me3) in human ES cells. Probes that do not have this histone mark information (listed in Supplemental Table 4 as “NA”) were not included in the bar chart calculations. The probes in each category are ordered according to the unsupervised hierarchal clustering using a correlation distance metric and average linkage method. The RPMM-based cluster assignments are indicated above the heatmaps.
Figure 5.
Figure 5.
Diagnostic CIMP-defining gene marker panel based on the Infinium DNA methylation data. A dichotomous heatmap of the Infinium DNA methylation data is shown. (Black bars) DNA methylation β-value ≥0.1; (white bars) DNA methylation β-value <0.1. The panel of five markers shown on the top (CIMP-H & CIMP-L) is used to identify CIMP-H and CIMP-L tumors. The panel of five markers shown on the bottom (CIMP-H specific) is used to specifically identify CIMP-H tumors.
Figure 6.
Figure 6.
Integrated analysis of gene expression and promoter DNA methylation changes between colorectal tumors and matched normal adjacent tissues. (A) Mean DNA methylation β-value differences between CIMP-H tumors and matched normal colonic tissues (n = 6) are plotted on the x-axis, and mean log2-transformed gene expression value differences are plotted on the y-axis for each gene. Red data points highlight those genes that are hypermethylated with a β-value difference >0.20 and show more than twofold decrease in their gene expression levels in CIMP-H tumors. (B) Pie chart showing the gene expression changes of 1534 hypermethylated genes in CIMP-H tumors compared with adjacent normal tissues. (C) Bar chart showing the number of genes that exhibit DNA hypermethylation and/or gene expression changes in non-CIMP tumors among the 112 genes that are hypermethylated and down-regulated in CIMP-H tumors.

References

    1. Barbosa-Morais NL, Dunning MJ, Samarajiwa SA, Darot JF, Ritchie ME, Lynch AG, Tavare S 2010. A re-annotation pipeline for Illumina BeadArrays: improving the interpretation of gene expression data. Nucleic Acids Res 38: e17 doi: 10.1093/nar/gkp942 - PMC - PubMed
    1. Baylin SB, Ohm JE 2006. Epigenetic gene silencing in cancer—a mechanism for early oncogenic pathway addiction? Nat Rev Cancer 6: 107–116 - PubMed
    1. Bernstein BE, Meissner A, Lander ES 2007. The mammalian epigenome. Cell 128: 669–681 - PubMed
    1. Bibikova M 2009. Genome-wide DNA methylation profiling using Infinium assay. Epigenomics 1: 177–200 - PubMed
    1. Campan M, Weisenberger DJ, Trinh B, Laird PW 2009. MethyLight. Methods Mol Biol 507: 325–337 - PubMed

Publication types