. 2011 Jun 10;332(6035):1322-6.
doi: 10.1126/science.1199484.

Phosphoproteomic analysis identifies Grb10 as an mTORC1 substrate that negatively regulates insulin signaling

Affiliations

Phosphoproteomic analysis identifies Grb10 as an mTORC1 substrate that negatively regulates insulin signaling

Yonghao Yu et al. Science. .

Abstract

The evolutionarily conserved serine-threonine kinase mammalian target of rapamycin (mTOR) plays a critical role in regulating many pathophysiological processes. Functional characterization of the mTOR signaling pathways, however, has been hampered by the paucity of known substrates. We used large-scale quantitative phosphoproteomics experiments to define the signaling networks downstream of mTORC1 and mTORC2. Characterization of one mTORC1 substrate, the growth factor receptor-bound protein 10 (Grb10), showed that mTORC1-mediated phosphorylation stabilized Grb10, leading to feedback inhibition of the phosphatidylinositol 3-kinase (PI3K) and extracellular signal-regulated, mitogen-activated protein kinase (ERK-MAPK) pathways. Grb10 expression is frequently down-regulated in various cancers, and loss of Grb10 and loss of the well-established tumor suppressor phosphatase PTEN appear to be mutually exclusive events, suggesting that Grb10 might be a tumor suppressor regulated by mTORC1.


Figures

Fig. 1
Fig. 1
Sample preparation and data analysis for quantitative phosphoproteomic profiling of the mTOR downstream signaling networks. (A) Schematics of the two SILAC mass spectrometry experiments are shown with a plot highlighting the ratio distribution of phosphopeptides identified in each screen. (See data summary in Table S1). Note that most of the phosphopeptides have a ratio of 1:1 between the light and heavy populations and hence have a value close to 0 on a Log2 axis. Proteins with downregulated phosphorylation in each screen are highlighted in the red box. (B) Typical MS and MS/MS spectra in which LS*SLRAS*TSKSESSQK from ribosomal protein S6 (S235 and S240) was identified as a rapamycin-sensitive phosphopeptide. The light and heavy peptides differ by 26 Da, corresponding to 2 labeled Lys and 1 labeled Arg in this particular peptide. (C) Quantitative differences between the rapamycin sensitive- and insensitive- mTOR downstream phosphorylation events. Phosphopeptides identified in both screens were extracted and their corresponding treatment/control ratios (See Table S1 for treatment conditions) were plotted on a Log2 scale. Log2(treatment/control) ≤ −1 is considered to be downregulated (See supplementary text for detailed discussion). (D) The top ten pathways enriched in the downregulated phospho-proteins identified in the Rapa screen.
Fig. 2
Fig. 2
Sensitivity of phosphorylation of Grb10 at S501 and S503 to rapamycin inhibition (A) Identification of a doubly-phosphorylated, rapamycin-sensitive Grb10 peptide (MNILSS*QS*PLHPSTLNAVIHR, asterisk indicates the site of phosphorylation at S501 and S503). (B) Phosphorylation of Grb10 at S501 and S503 shows rapamycin sensitivity in vivo. Tsc2−/− cells were starved for serum and treated with 20 nM rapamycin for the indicated times. (C) Phosphorylation of Grb10 at S501 and S503 is sensitive to amino acids withdrawal. Tsc2−/− cells were serum-deprived in DMEM overnight and then transferred to a media of DMEM minus amino acids for the indicated times. (D) Phosphorylation of Grb10 at S501 and S503 is not affected by the pan-kinase inhibitor, staurosporine. Tsc2−/− cells were starved for serum and treated with either 100 nM staurosporine or Ku-0063794 at the indicated concentrations for two hours. (E) Grb10 phosphorylation is increased upon growth factor stimulation. wt MEFs were starved for serum overnight and then were stimulated with either insulin (100 nM) or serum (10%) for 15 min. Cells were preincubated with the indicated compounds for two hours. AktVIII (1 µM) and AZD (AZD6244, 5 µM) are specific inhibitors of Akt and MEK, respectively. Rapa (rapamycin) was used at 20 nM. (F) Grb10 phosphorylation at S501 and S503 is sensitive to various mTOR kinase inhibitors. Tsc2−/− cells were serum-starved and treated with the indicated compounds for two hours. The concentrations of the compounds were, Rapa (rapamycin) 20 nM, LY (LY294002) 20 µM, BEZ235 (NVP-BEZ235) 500 nM, torin 100 nM and pp242 1 µM. Phosphorylation levels in this figure were measured with phospho-specific antibodies against Grb10 (S501, S503), S6K (T389), S6 (S235, S236), Akt (S473), 4EBP (T37, T46) and ERK1/2 (T202, Y204)
Fig. 3
Fig. 3
Effect of mTOR-mediated phosphorylation to promote stability of Grb10. (A) Grb10 interacts with raptor, but not rictor. HA-tagged Grb10 was transfected with Myc-raptor or Myc-rictor into HEK293T cells. Cells were lysed in lysis buffer A and the lysates were subjected to immunoprecipitation using anti-HA antibody conjugated beads. Raptor and rictor were probed with an antibody against the Myc-tag. WCL, whole cell lysates. (B) Grb10 is phosphorylated by mTOR in vitro. Recombinant GST-Grb10 was prepared from bacteria and was incubated with recombinant mTOR in vitro. Phosphorylation of Grb10 at S501 and S503 was detected by using the phospho-specific antibody against these two sites. S6K and RSK were used as the positive and negative controls, respectively and the experiments were performed in parallel with the mTOR-Grb10 in vitro kinase assay. WB, western blotting. (C) Grb10 is highly overexpressed in Tsc2 −/− cells. (D) Long-term rapamycin treatment leads to Grb10 degradation in Tsc2 −/− cells. Note that Grb10 protein expression levels inversely correlated with Akt activity. mRNA level was determined using quantitative RT-PCR based on three biological replicate experiments. (E) Knockdown of raptor in Tsc2 −/− cells decreased Grb10 protein level. Cells were starved overnight and the lysates were probed with the antibodies indicated. (F) S501A–S503A mutant is unstable compared with the wild-type or the S501D–S503D mutant. The same amount of DNA was transfected into HEK293T cells. (G) Rapamycin failed to induce degradation of the S501D–S503D mutant. S501D–S503D mutant (DD) was stably expressed in Tsc2 −/− cells and cells were treated with 20 nM rapamycin for the indicated times. Endogenous Grb10 was detected using an antibody that preferentially recognizes mouse Grb10 whereas the Grb10 DD mutant (of human origin) was detected using an anti-HA antibody. Phosphorylation levels in this Figure were measured with phospho-specific antibodies against Grb10 (S501, S503), S6K (T389), RSK (T573), Akt (S473) and 4EBP (T37, T46).
Fig. 4
Fig. 4
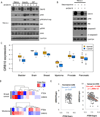
Grb10 is involved in the feedback inhibition loop from mTORC1 to PI3K and ERK-MAPK, and GRB10 mRNA expression is decreased in abundance in many cancers and is negatively correlated with PTEN expression. (A) Knockdown of Grb10 in Tsc2−/− cells resulted in PI3K and ERK-MAPK hyperactivation after insulin or IGF stimulation. C, shGFP. 1, shGrb10 #1. 2, shGrb10 #2. Phosphorylation levels were measured against Akt (S473) and ERK1/2 (T202, Y204). (B) Knockdown of Grb10 in Tsc2 −/− cells protected cells against apoptosis. Grb10 knockdown and control cells were starved overnight and then treated with 100 nM staurosporine for 5 hrs to induce apoptosis. Phosphorylation levels were measured against Akt (S473). (C) Box plots indicating that GRB10 expression is significantly lower in many tumor types compared to their corresponding normal tissues. (Only the tumor types that showed significantly lower GRB10 expression in cancer vs. normal in at least three independent microarray datasets are included, p < 0.01, Log-rank test). (D) Heat maps indicating a strong negative correlation between GRB10 and PTEN expression in myelomas and breast carcinomas. Low levels of GRB10 expression rarely occurred in tumors that also showed low levels of PTEN expression. The z-scores (from −1 to +1) of the normalized expression values for the corresponding cancer datasets on Fig 4C are shown. Red, lower expression compared to mean (white). Blue, higher expression compared to mean (white). (E) Scatter plots comparing the expression levels of GRB10 and PTEN in the normal and tumor samples, collected from 6 different tissue types indicated in Fig. 4C. The negative correlation between GRB10 and PTEN expression is evident in the tumor but not in the corresponding normal samples.

Comment in

References

    1. Alessi DR, Pearce LR, Garcia-Martinez JM. Sci Signal. 2009;2:27. - PubMed
    1. Choo AY, Blenis J. Cell Cycle. 2009;8:567. - PubMed
    1. Ma XM, Blenis J. Nat Rev Mol Cell Biol. 2009;10:307. - PubMed
    1. Cloughesy TF, et al. PLoS Med. 2008;5:e8. - PMC - PubMed
    1. Carracedo A, et al. J Clin Invest. 2008;118:3065. - PMC - PubMed

Publication types

MeSH terms