. 2012 Jan;19(1):144-52.
doi: 10.1038/cdd.2011.78. Epub 2011 Jun 10.

Autophagy promotes T-cell survival through degradation of proteins of the cell death machinery

Affiliations

Autophagy promotes T-cell survival through degradation of proteins of the cell death machinery

J R Kovacs et al. Cell Death Differ. 2012 Jan.

Abstract

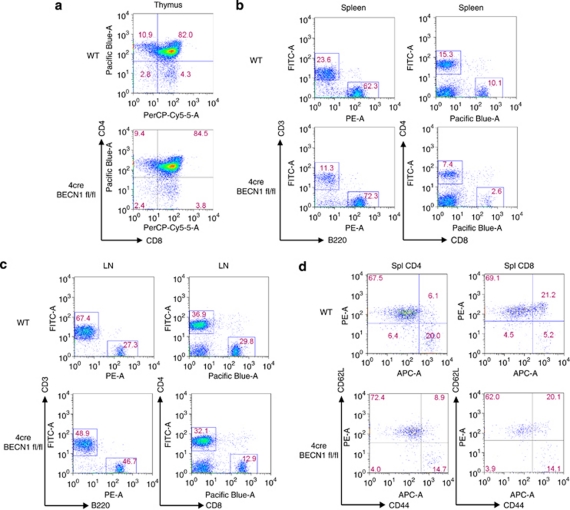
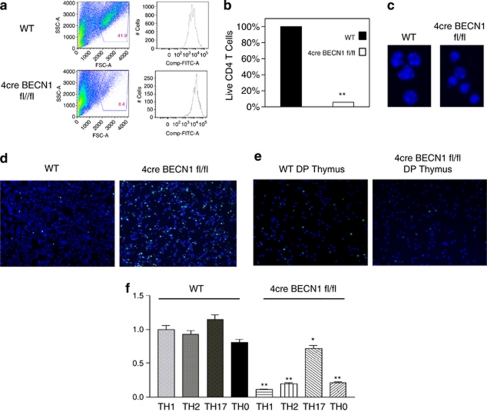
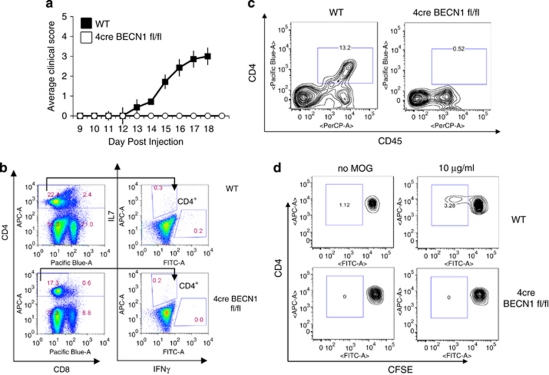
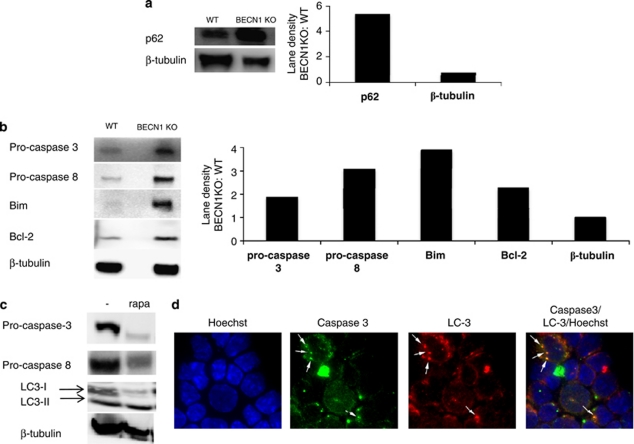
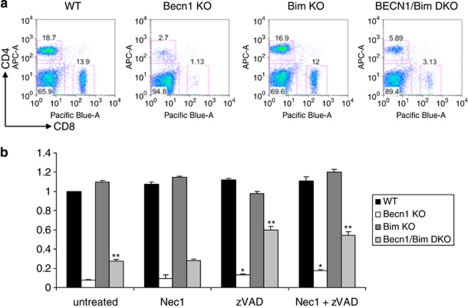
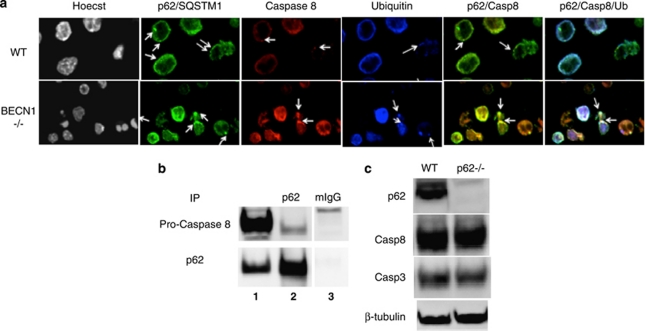
Autophagy is implicated in regulating cell death in activated T cells, but the underlying mechanism is unclear. Here, we show that inhibition of autophagy via Beclin 1 gene deletion in T cells leads to rampant apoptosis in these cells upon TCR stimulation. Beclin 1-deficient mice fail to mount autoreactive T-cell responses and are resistant to experimental autoimmune encephalomyelitis. Compared with Th17 cells, Th1 cells are much more susceptible to cell death upon Beclin 1 deletion. Cell death proteins are highly increased in Beclin 1-deficient T cells and inhibition of caspases and genetic deletion of Bim reverse apoptosis. In addition, p62/sequestosome 1 binds to caspase-8 but does not control levels of procaspase-8 or other cell death-related proteins. These results establish a direct role of autophagy in inhibiting the programmed cell death through degradation of apoptosis proteins in activated T cells.


Figures

Figure 1
Figure 1
Modest reduction of peripheral CD4+ T cells in 4cre BECN1 fl/fl mice. Flow cytometry analysis of single-cell suspensions from thymus (a), spleen (b) and lymph node (c), which were stained for surface markers CD4, CD8, CD3 and B220. (d) Analysis of naïve and memory T cells (CD4, left; CD8, right), which were stained for CD44 and CD62L
Figure 2
Figure 2
Beclin 1-deficient CD4+ T cells undergo increased levels of apoptotic cell death upon TCR stimulation. CD4+ T cells were isolated from spleens of WT (top) and 4cre BECN1 fl/fl mice (bottom), stained with CFSE and stimulated under Th1 conditions for 72 h. Cell death was assessed by flow cytometry by forward and side scatter gating of blasted lymphocytes (a). The survival of WT cells was set as 100%, and the percentage of live Beclin 1-deficient CD4+ T cells versus WT cells were quantified (b). The morphology of cell nuclei was revealed by fluorescent microscopy after staining cells with Hoechst 33342 dye (blue; c). (d) WT and 4cre BECN1 fl/fl CD4+ T cells were stimulated by anti-CD3 and anti-CD28 for 24 h. TUNEL (green) assay was performed and counter stained by Hoechst 33342 dye (blue). (e) TUNEL analysis was performed for double-positive (DP) and single-positive (CD4+, SP) thymocytes upon anti-CD3 and anti-CD28 stimulation for 24 h. All results are representative of n≥3 independent experiments. (f) Naïve CD4+ T cells were isolated from spleens of WT and 4cre BECN1 fl/fl mice and cultured under Th1, Th2, Th17 and Th0 conditions for 72 h. Cell death was assessed by flow cytometry by forward and side scatter gating of blasted lymphocytes. The percentage of live WT cells in the Th1 condition was set as 100%. Ratio of surviving Beclin 1-deficient CD4+ T cells cultured in other conditions versus the Th1 condition was calculated and shown. Student's t-test was performed to compare WT with Beclin 1-deficient CD4+ T cells cultured in the same conditions. *P<0.05 and **P<0.001. The color reproduction of this figure is available at the Cell Death and Differentiation Journal online
Figure 3
Figure 3
The clinical course of active EAE in 4cre BECN1 fl/fl mice is inhibited. (a) Active EAE was induced in WT (filled circles, n=14) and Beclin 1-deficient mice (open circles, n=6). Clinical disease was monitored for 20 days as described in the Materials and Methods. (b) Splenocytes from WT or Beclin 1-deficient mice induced for EAE (day 15) were cultured with MOG peptide (20 μg/ml). After 18-h culture, the cells were harvested and intracellular staining was performed (IL-17 and IFN-γ), and cytokine-producing CD4+ T cells were analyzed by flow cytometry. (c) CNS-infiltrating lymphocytes were isolated from WT or Beclin 1-deficient mice induced for EAE (day 15) and analyzed by flow cytometry (CD4 and CD45). (d) Splenocytes were isolated from mice that had been induced for EAE for day 15. These cells were stained with CFSE, cultured with the MOG peptide (20 μg/ml) for 72 h and subsequently analyzed by flow cytometry to determine an antigen-specific proliferating population of CD4+ T cells
Figure 4
Figure 4
Beclin 1-deficient CD4+ T cells accumulate cell death-related protein upon activation. WT and 4cre BECN1 fl/fl CD4+ T cells were stimulated for 48 h by anti-CD3 and anti-CD28. At this point, CD4+ cells were re-isolated by positive selection and extract was made for western analysis. The results shown are western blot analyses of p62 (a) and apoptosis proteins, caspase-3, Bim, Bcl-2 and caspase-8 (b). (c) Rapamycin was added at 44 h, and extracts were made at 48 h subjected to western blot analysis. (d) Naïve WT CD4+ T cells were cultured in the Th1 condition for 72 h and then treated with rapamycin for 4 h. Cells were stained with antibodies as indicated. Fluorescence images were obtained. Arrows indicate dots that are positive for both caspase-3 and LC-3
Figure 5
Figure 5
Caspases and Bim are involved in cell death upon autophagy blockade. (a) Flow cytometry analysis of splenocytes from WT, 4cre BECN1−/−, Bim−/− and 4cre BECN1−/− Bim−/− mice. (b) CD4+ T cells from WT, 4cre BECN1 fl/fl, Bim−/− and BECN1/BIM DKO were stimulated for 72 h with or without chemical inhibitors. Results are presented as a survival ratio based on live cells relative to that of untreated WT cells, which is set as 1. Pairwise t-test statistical analysis was completed for each treatment group relative to untreated BECN1 fl/fl group survival ratio. **P<0.001 and *P< 0.05
Figure 6
Figure 6
Caspase-8 is found in p62/ubiquitin-containing aggregates in BECN1-deficient T cells. (a) WT and 4cre BECN1 fl/fl CD4+ T cells were stimulated for 48 h by anti-CD3/anti-CD28 (arrows pointing to aggregates). Cells were stained with antibodies, as indicated. Confocal images were obtained. (b) CD4+ T-cell lysates were immunoprecipitated with anti-p62 antibodies (lane 2) and subjected to western blot with antibodies, as indicated. Extracts equal to 1/20 of the amount used for immunoprecipitation was used as control (lane 1). (c) Naïve WT and p62−/− CD4+ T cells were stimulated for 48 h by anti-CD3 and anti-CD28. Extracts were made for western blot analysis for p62, caspase-3, caspase-8 and β-tubulin, as indicated. The results are representative of three independent experiments. One pair of mice was used for each experiment

References

    1. Cuervo AM. Autophagy: many paths to the same end. Mol Cell Biochem. 2004;263:55–72. - PubMed
    1. Levine B, Klionsky DJ. Development by self-digestion: molecular mechanisms and biological functions of autophagy. Dev Cell. 2004;6:463–477. - PubMed
    1. Shintani T, Klionsky DJ. Autophagy in health and disease: a double-edged sword. Science. 2004;306:990–995. - PMC - PubMed
    1. Mizushima N, Klionsky DJ. Protein turnover via autophagy: implications for metabolism. Annu Rev Nutr. 2007;27:19–40. - PubMed
    1. Klionsky DJ. The molecular machinery of autophagy: unanswered questions. J Cell Sci. 2005;118 (Part 1:7–18. - PMC - PubMed

Publication types

MeSH terms

LinkOut - more resources