. 2011 Jun 10;145(6):875-89.
doi: 10.1016/j.cell.2011.05.017.

Pluripotency factors in embryonic stem cells regulate differentiation into germ layers

Affiliations

Pluripotency factors in embryonic stem cells regulate differentiation into germ layers

Matt Thomson et al. Cell. .

Abstract

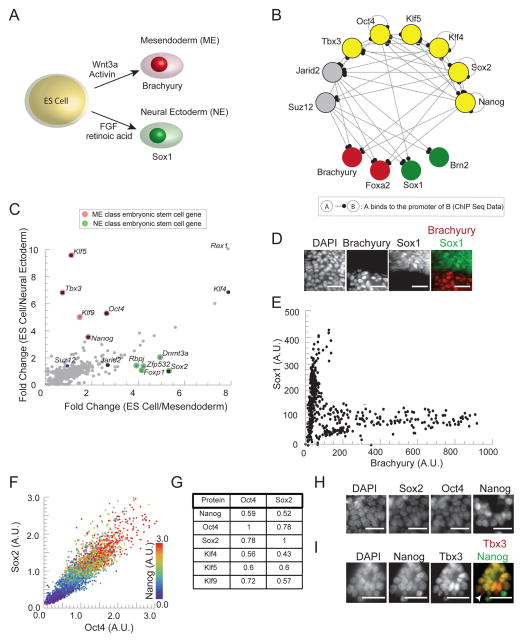
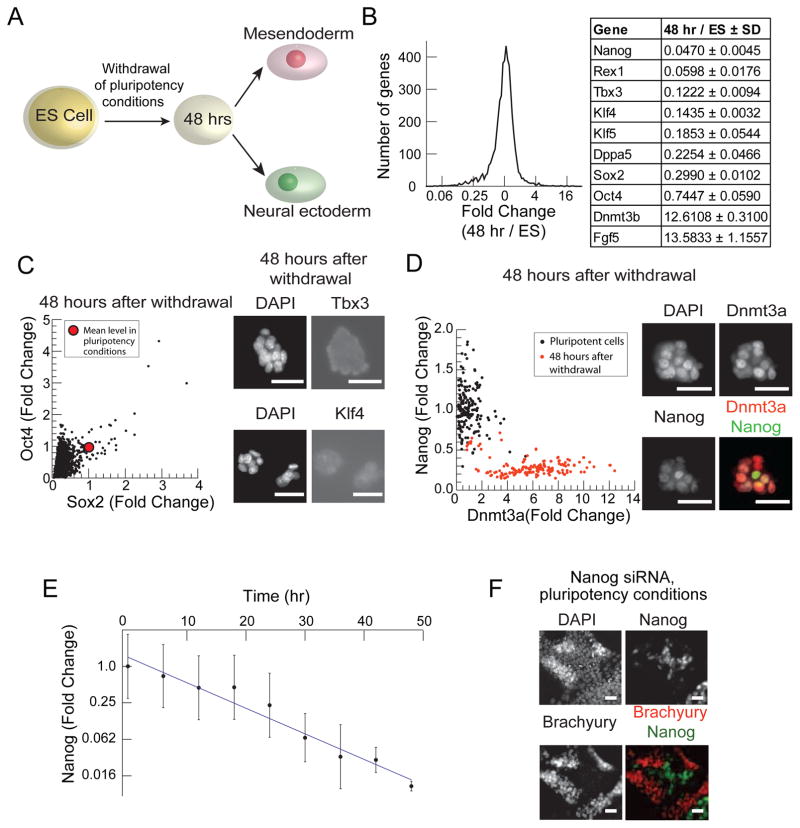
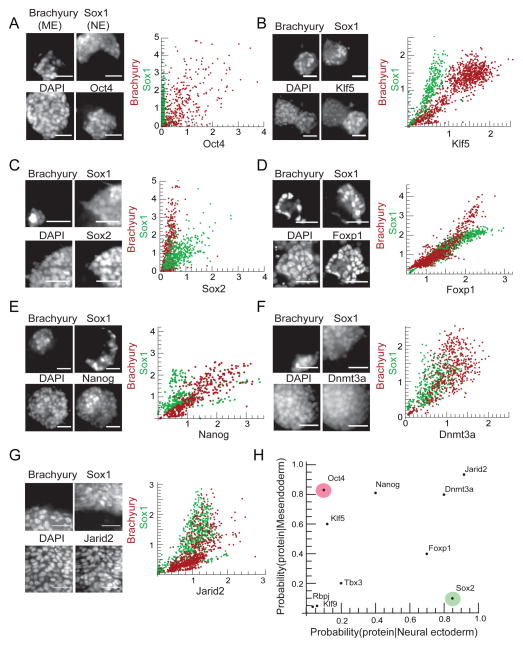
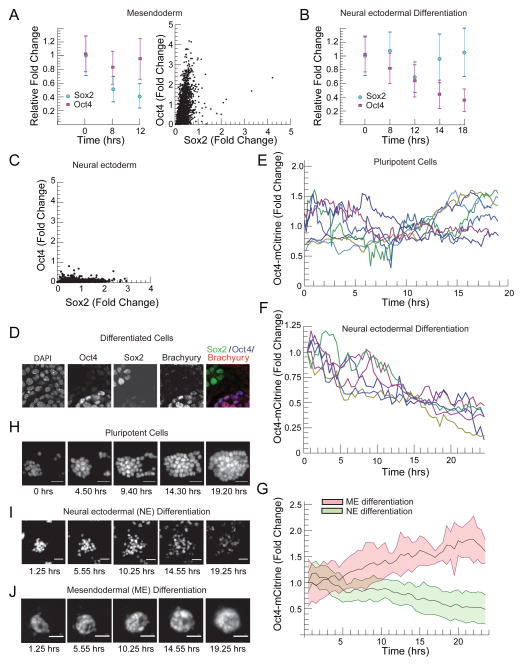
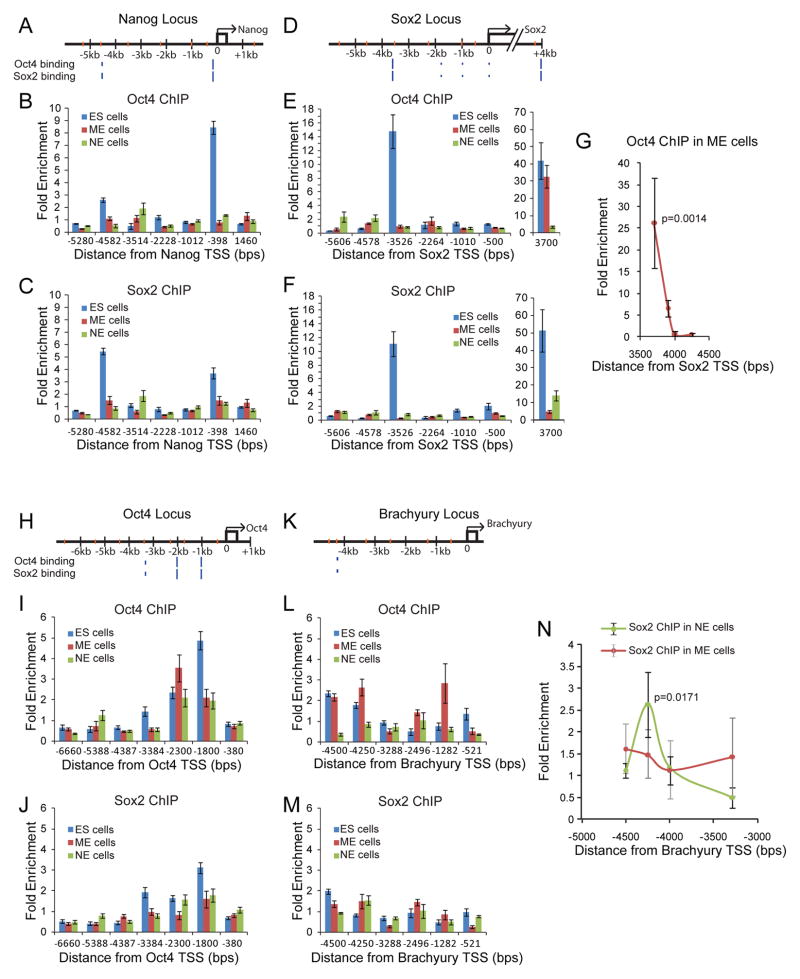
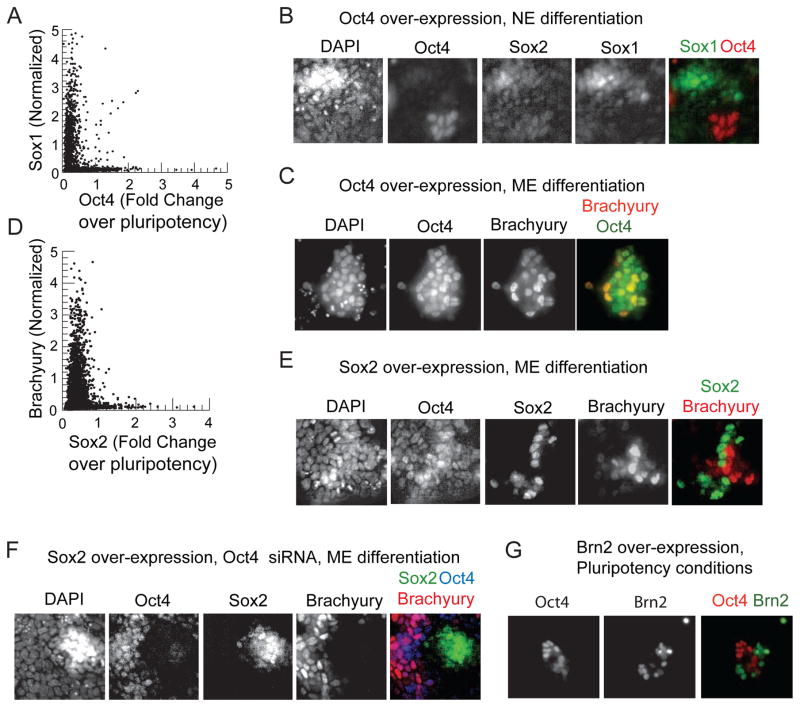
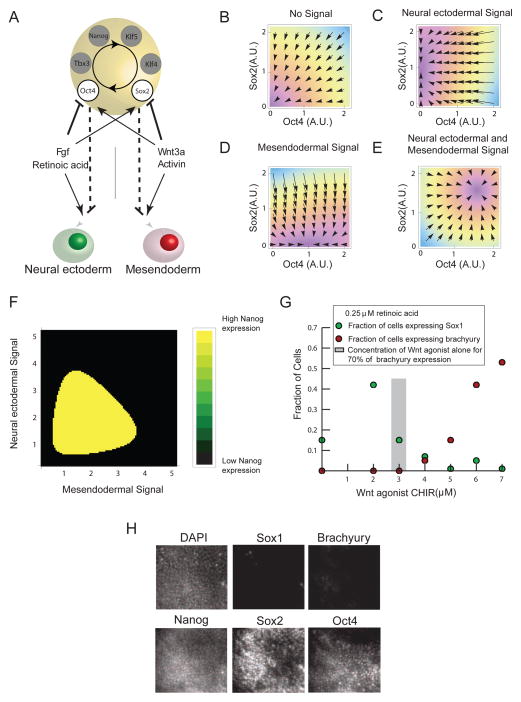
Cell fate decisions are fundamental for development, but we do not know how transcriptional networks reorganize during the transition from a pluripotent to a differentiated cell state. Here, we asked how mouse embryonic stem cells (ESCs) leave the pluripotent state and choose between germ layer fates. By analyzing the dynamics of the transcriptional circuit that maintains pluripotency, we found that Oct4 and Sox2, proteins that maintain ESC identity, also orchestrate germ layer fate selection. Oct4 suppresses neural ectodermal differentiation and promotes mesendodermal differentiation; Sox2 inhibits mesendodermal differentiation and promotes neural ectodermal differentiation. Differentiation signals continuously and asymmetrically modulate Oct4 and Sox2 protein levels, altering their binding pattern in the genome, and leading to cell fate choice. The same factors that maintain pluripotency thus also integrate external signals and control lineage selection. Our study provides a framework for understanding how complex transcription factor networks control cell fate decisions in progenitor cells.


Figures

Figure 1
Figure 1. ES cells, defined by correlated expression of pluripotency factors, select between NE and ME fate in vitro
(A) ES cells lose pluripotency and differentiate into mesendodermal (ME) progenitor cells to express Brachyury in response to Wnt3a or Wnt agonist, CHIR. They differentiate into neural ectoderm (NE) progenitors to express Sox1 in response to FGF signals or retinoic acid. (B) Diagram of interactions between the pluripotency factors (yellow), key epigenetic regulators (grey), and regulators of the ME (red) and NE (green) lineage inferred from ChIP-seq data in the literature (C) Plot of fold change in expression levels (obtained from microarray data in (Shen et al., 2008)) of genes expressed in ES cells compared to their expression in ME progenitors (x axis) versus the same fold change comparison in NE progenitors (y-axis). Pluripotency factors and key epigenetic regulators are indicated with black dots, ME class genes in red and NE class genes in green. (D) Fluorescence images of Sox1-GFP ES cells exposed to 3μM CHIR and stained with DAPI and immunostained for Brachyury show cytoplasmic GFP expression (green, NE marker) or nuclear Brachyury expression (red, ME marker). Scale bar 32μm (E) Scatter plot of Sox1 levels vs. Brachyury levels in differentiated cells. Each point represents Brachyury and Sox1-GFP signal in a single cell. (F) Scatter plot of protein levels in single cells for Oct4, Sox2, and Nanog derived from immunofluorescence measurements for n > 1000 ES cells growing in LIF and BMP. Protein levels measured in units normalized to the population mean. Figure S1F shows population distributions of Oct4 and Sox2 protein levels. (G) Pearson correlation coefficients for pairs of pluripotency factors measured using immunofluorescence and FACS. (H) Fluorescence images of ES cell nuclei stained simultaneously for DAPI, Sox2, Oct4 and Nanog. Scale bars 32 μm. (I) Fluorescence images of ES cells stained for DAPI, Nanog and Tbx3. White arrow points to punctate Tbx3 expression (red) in a nucleus with low Nanog (green). Intensity of the delocalized nuclear Tbx3 and Nanog have a correlation of R = .65. Scale bars 32 μm. See also Figure S1.
Figure 2
Figure 2. Down regulation of ES cell specific factors is necessary for differentiation
(A) Schematic of ES cell differentiation protocol. 48 hours after the withdrawal of pluripotency promoting conditions (LIF and BMP), cells are exposed to differentiation signals. Cells then respond to ME inducing signals (Wnt3a or CHIR) by activating Brachyury and to NE inducing signals (retinoic acid or endogenous FGF) by activating Sox1. (B) Histogram of fold change of mRNA expression levels in the cell population 48 hours after withdrawal of LIF and BMP as measured by microarray. Table shows fold changes for a set of pluripotency factors as well as for Dnmt3b and Fgf5. (C) The scatter plot (left) of Oct4 vs. Sox2 expression in n > 1000 single cells 48 hours after withdrawal of pluripotency conditions. The red dot indicates mean expression level of these proteins in pluripotency conditions. Fluorescent images of cells immunostained for DAPI, Tbx3 (above) and Klf4 (below) 48 hours after withdrawal of pluripotency conditions. Scale bar 32μm (D) Scatter plot of Nanog vs. Dnmt3a levels in single cells under pluripotency supporting conditions (black) and 48 hours after the withdrawal of pluripotency conditions (orange). Images of cells immunostained for DAPI, Dnmt3a (red) and Nanog (green) 48 hours after pluripotency condition withdrawal. Scale bars 32 μm. (E) Plot of the fold changes of mean Nanog protein levels (> 20,000 cells) in cell populations fixed every 6 hours following withdrawal of LIF and BMP. Error bars indicate ±SD in Nanog protein levels in the cell population. Solid line shows Nanog decay fit to an exponential with a half-life of 7.5 hours. (F) Fluorescence images of cells in pluripotency conditions, LIF and BMP, stained for DAPI, Nanog, and Brachyury following CHIR addition for 24 hours and siRNA knock-down of Nanog. siRNA construct was added to cells for 24 hours prior to CHIR exposure. Scale bars 32μm.
Figure 3
Figure 3. Key ES cell transcription factors are differentially expressed in ME and NE cells
Cells were differentiated in conditions (see Experimental Procedures) where some cells adopted the ME fate (Brachyury positive) and others adopted the NE fate (Sox1-GFP positive). Images of a field of cells immunostained 36 hours after signal addition for ME marker Brachyury, NE marker Sox1, DAPI, and a specific factor (left panel); scatter plots (right panel) of the expression level of that factor against Brachyury in n > 300 Brachyury positive cells (red points) and against Sox1, n > 300 Sox1 positive cells (green points) for (A) Oct4, (B) Klf5, (C) Sox2, (D) Foxp1, (E) Nanog, (F) Dnmt3a and (G) Jarid2. All scale bars 32μm. (H) The data from A–G are summarized in a conditional probability plot. Each point in the plot represents the probability of finding the expression of the specific protein in ME progenitors (y-axis) versus NE progenitors (x-axis). See also Figure S3.
Figure 4
Figure 4. Oct4 and Sox2 protein levels diverge continuously during lineage selection
(A) Left Panel, plot of mean ± SD of Oct4 (Purple squares) and Sox2 (blue circles) protein levels in n>40000 cells at 0,8, and 12 hours following CHIR addition, measured simultaneously in single cells using immunofluorescence and FACS. Protein levels normalized to the mean protein level in the cell population prior to signal addition. Right panel, scatter plot of Oct4 and Sox2 protein levels 24 hours after signal addition in single ME progenitor cells (~2400 cells), levels normalized to the mean level of these proteins in pluripotent cells. (B) Plot of mean ± SD of Oct4 (purple squares) and Sox2 (blue circles) levels in populations of n > 40,000 cells following RA addition (C) Scatter plot of Oct4 vs. Sox2 protein levels in n > 2000 cells 24 hours after RA addition. Protein levels normalized to the mean protein level in the cell population prior to signal addition. (D) Confocal microscopy images of cells undergoing ME differentiation stained for DAPI, Oct4, Sox2 and Brachyury. (E) Single cell trajectories of Oct4-mCitrine levels obtained using time lapse microscopy for ES cells growing under pluripotency promoting conditions. (F) Single cell trajectories of Oct4-mCitrine in cells differentiating into the neural ectodermal lineage. Conditions supporting pluripotency were removed for 48 hours and then retinoic acid (500nM) was added at t=0 to induce differentiation. (G) Temporal trajectories of Oct4-mCitrine in n >100 cells differentiating into NE (mean in solid line, standard deviation as a light green background) and ME progenitors (mean in solid line, standard deviation as a light red background) obtained by fluorescence time-lapse microscopy of the Oct4-mCitrine cell line (t=0 corresponds to time of signal addition, Figure 2A). (H–J) Fluorescence images from a time lapse imaging experiment following a field of Oct4-mCitrine cells (H) under pluripotency promoting conditions, (I) during retinoic acid driven NE differentiation, and (J) during CHIR driven ME differentiation. All scale bars 32 μm. See also Figure S4
Figure 5
Figure 5. Oct4 and Sox2 bind asymmetrically in NE and ME regulatory regions during differentiation
ChIP-qPCR assays for Oct4 and Sox2 binding at Nanog (A,B,C), Sox2 (D,E,F,G), Oct4 (H,I,J), and Brachyury (K,L,M,N) loci in ES (blue bars), ME (red bars), and NE (green bars) cells. Each genomic region is depicted with qPCR primer coordinates (orange hashes) and previously reported Oct4 and Sox2 ES cell-specific binding sites (blue hashes, hash heights proportional to published ChIP-seq peak heights). Mean fold enrichment is normalized to input, and error bars represent ±SEM of technical triplicates. X-axis represents positions relative to the transcriptional start site. (G) ME lineage specific binding of Oct4 at the Sox2 +3700bp neural enhancer probed with multiple primer pairs. Each point and error bars represent mean enrichment values ±SEM for 3 biological replicates (p=0.0014). (N) Lineage specific binding of Sox2 at the Brachyury −4250bp region was probed with multiple primer pairs. Points show mean enrichment values for Sox2 in the NE lineage (green circles) and ME lineage (red circles) over 3 biological replicates. Error bars (black for NE lineage, gray ME lineage) represent ±SEM of biological replicates. NE peak at −4250bp has p = 0.0171 while ME enrichment has p= 0.37.
Figure 6
Figure 6. Oct4 specifically represses the NE lineage and Sox2 the ME lineage
(A) Scatter plot of Oct4 vs. Sox1 in 2500 cells from a population in which constitutive Oct4 plasmid has been transfected and neural differentiation inducing signal retinoic acid (1μM) was added. Oct4 levels are measured as fold change over levels in ES cells under pluripotency conditions (B) Images of cells from A co-stained for Oct4, Sox2, Sox1, and DAPI. (C) Images of cells transfected with a constitutive Oct4 plasmid for 24 hours prior to CHIR induced ME differentiation co-stained for Oct4, Brachyury, and DAPI. (D) Scatter plot of Brachyury vs. Sox2 in over 5000 cells transfected with a Sox2 plasmid 24 hours prior to the induction of mesendodermal differentiation with 200ng/ml Wnt3a (identical results obtained with CHIR, data not shown) co-stained for Sox2, Brachyury and DAPI (E) Images of cells from D (F) Images of cells transfected with siRNA against Oct4 and a constitutive Sox2 plasmid co-stained for Oct4, Sox2, Brachyury and DAPI. (G) Images of ES cells transfected with a Brn2 plasmid and stained for Brn2 and Oct4 under pluripotency promoting conditions. See also Figure S5.
Figure 7
Figure 7. The architecture of the pluripotency circuit enables signal integration and lineage choice
(A) Model for the coupling between the pluripotency circuit, differentiation signals, and cell fates based upon data from Figures 3, 4 and 5. The asymmetric inhibition of Oct4 and Sox2 by differentiation signals competes with positive feedback between circuit elements (circular arrow), Oct4, Sox2, Nanog, Klf5, Klf4, Tbx3. (B–E) Plots of the Oct4 and Sox2 phase space showing the stable fixed points in the presence of different combinations of differentiation signals as defined by the mathematical model (Supplemental Experimental Procedures). In each panel, arrows depict the magnitude and direction of the time rate of change of Oct4 and Sox2 concentration in Oct4 and Sox2 space. Conditions are (B) in the absence of differentiation signals (C) In the presence of NE inducing signals (D) In the presence of ME inducing signals (E) In the presence of inducers of both lineages. (F) Plot of steady state Nanog level for combinations of ME and NE inducing signals. Nanog is near zero in black regions but is present at ES cell levels in yellow regions. (G) A titration of the Wnt agonist CHIR in cells also treated with 250nM retinoic acid. Green dots show fraction of cells activating Sox1 and red dots indicate fraction of cells activating Brachyury. (H) Images of Sox1-GFP cells treated with 5uM CHIR and 250nM retinoic acid immunostained for Brachyury, Oct4, Sox2, and Nanog. See also Figure S6.

Comment in

References

    1. Abranches E, Silva M, Pradier L, Schulz H, Hummel O, Henrique D, Bekman E. Neural differentiation of embryonic stem cells in vitro: a road map to neurogenesis in the embryo. PLoS One. 2009;4:e6286. - PMC - PubMed
    1. Anderson DJ. Stem cells and pattern formation in the nervous system: the possible versus the actual. Neuron. 2001;30:19–35. - PubMed
    1. Briscoe J, Pierani A, Jessell TM, Ericson J. A homeodomain protein code specifies progenitor cell identity and neuronal fate in the ventral neural tube. Cell. 2000;101:435–445. - PubMed
    1. Cantor AB, Orkin SH. Hematopoietic development: a balancing act. Curr Opin Genet Dev. 2001;11:513–519. - PubMed
    1. Chen X, Xu H, Yuan P, Fang F, Huss M, Vega VB, Wong E, Orlov YL, Zhang W, Jiang J, et al. Integration of external signaling pathways with the core transcriptional network in embryonic stem cells. Cell. 2008:1106–1117. - PubMed

Publication types

MeSH terms

Associated data