. 2011 Aug 6;342(1-2):32-40.
doi: 10.1016/j.mce.2011.05.025. Epub 2011 Jun 1.

1,25-Dihydroxyvitamin D(3) regulates PTHrP expression via transcriptional, post-transcriptional and post-translational pathways

Affiliations

1,25-Dihydroxyvitamin D(3) regulates PTHrP expression via transcriptional, post-transcriptional and post-translational pathways

Vandanajay Bhatia et al. Mol Cell Endocrinol. .

Abstract

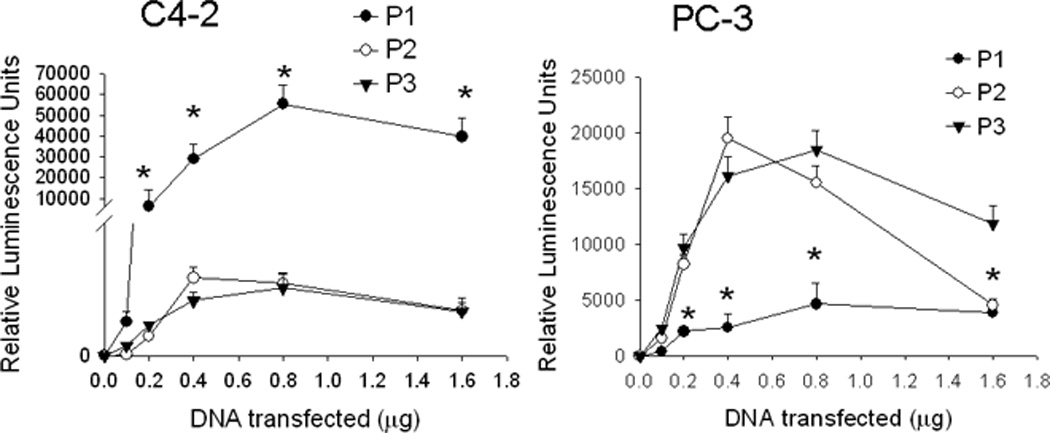
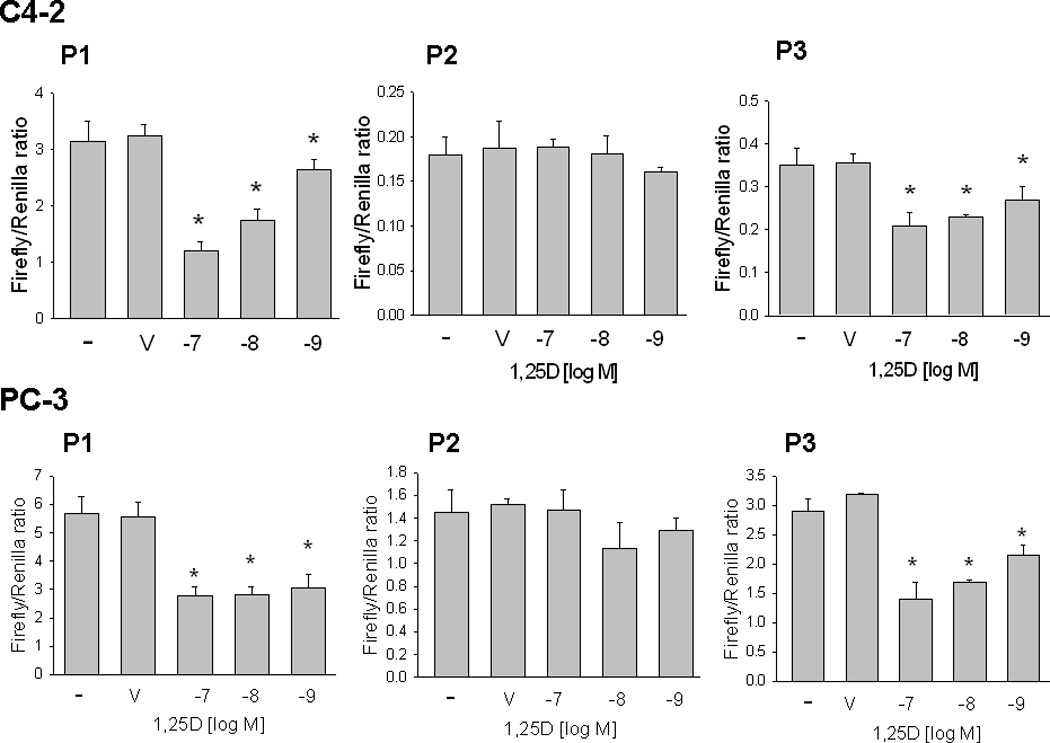
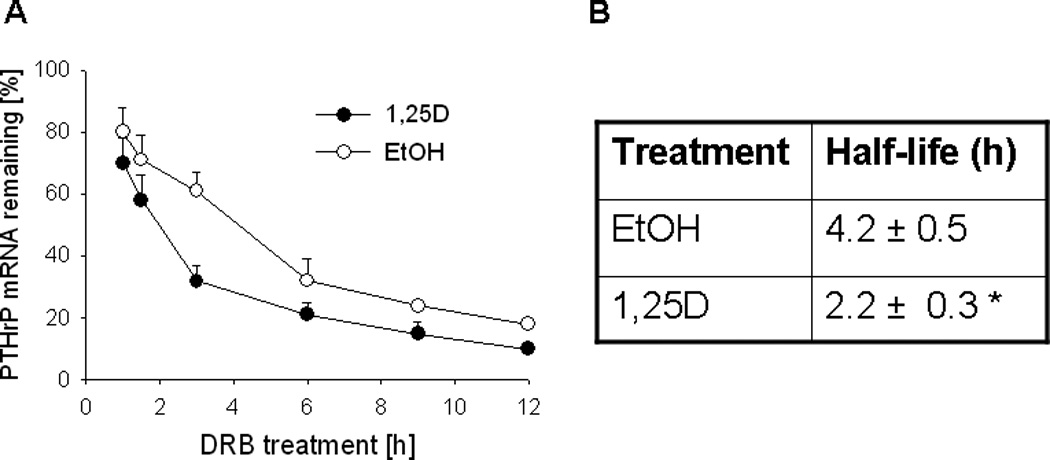
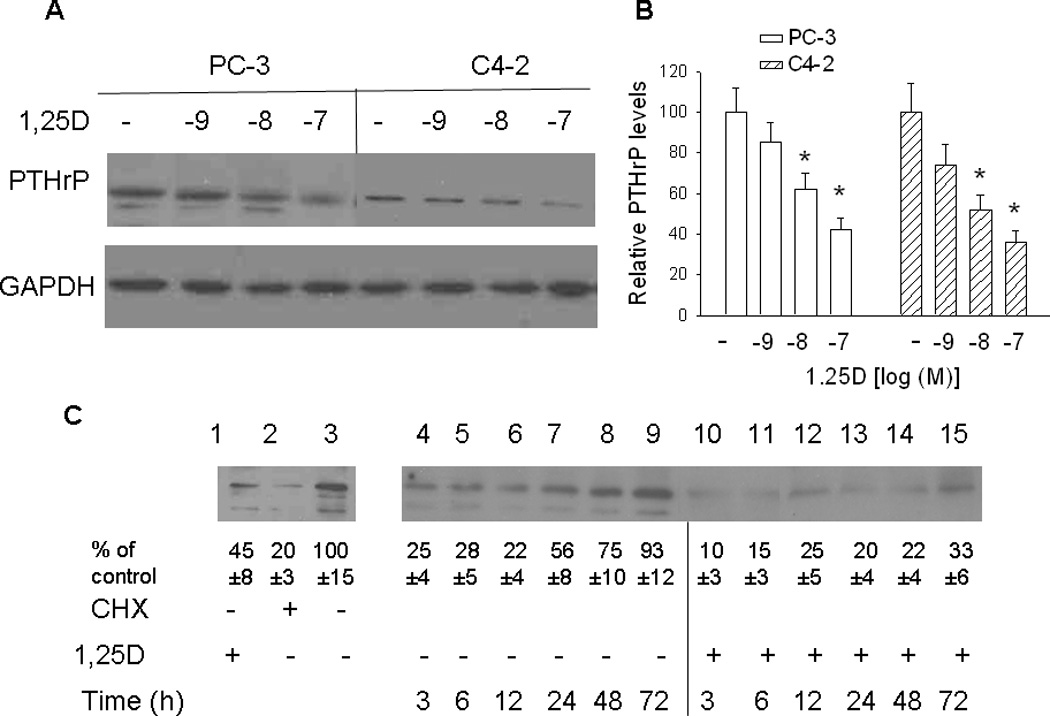
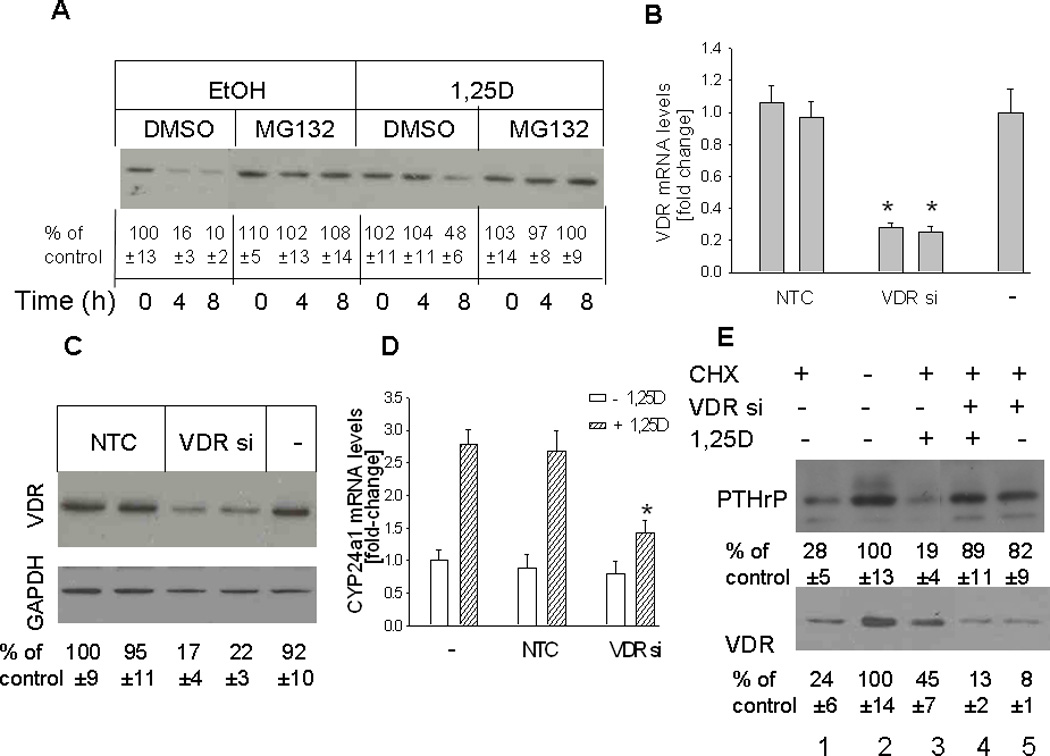
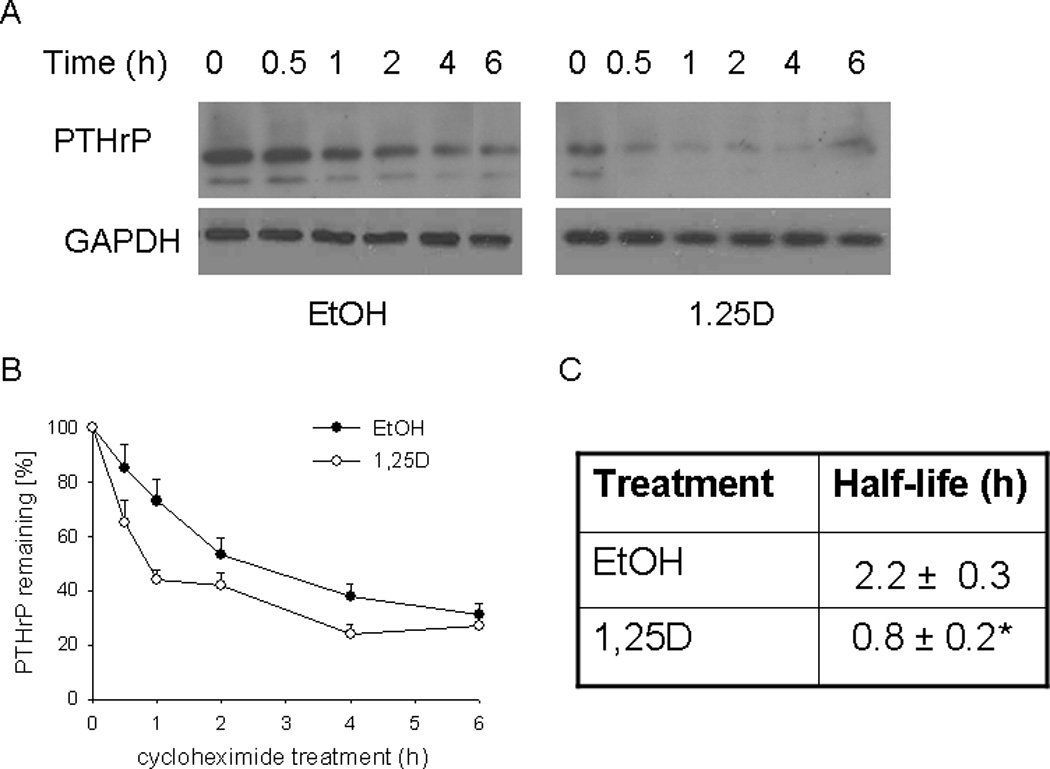
Parathyroid hormone-related protein (PTHrP) increases the growth and osteolytic potential of prostate cancer cells, making it important to control PTHrP expression. PTHrP expression is suppressed by 1,25-dihydroxyvitamin D(3) (1,25D). The aim of this study was to identify the pathways via which 1,25D exerts these effects. Our main findings are that 1,25D regulates PTHrP levels via multiple pathways in PC-3 and C4-2 (human prostate cancer) cell lines, and regulation is dependent on VDR expression. The human PTHrP gene has three promoters (P); PC-3 cells preferentially utilize P2 and P3, while C4-2 cells preferentially utilize P1. 1,25D regulates PTHrP transcriptional activity from both P1 and P3. The 1,25D-mediated decrease in PTHrP mRNA levels also involves a post-transcriptional pathway since 1,25D decreases PTHrP mRNA stability. 1,25D also suppresses PTHrP expression directly at the protein level by increasing its degradation. Regulation of PTHrP levels is dependent on VDR expression, as using siRNAs to deplete VDR expression negates the 1,25D-mediated downregulation of PTHrP expression. These results indicate the importance of maintaining adequate 1,25D levels and VDR status to control PTHrP levels.


Figures

Figure 1
Figure 1. PTHrP promoter usage in C4-2 and PC-3 cells
Cells were transfected with the indicated amounts of promoter-driven luciferase reporter construct DNA for promoters 1, 2 and 3 (P1, P2 or P3). Luciferase activity was measured after 24 h. Control (empty vector) values were subtracted from the respective firefly and Renilla luciferase values. Values were normalized to Renilla luciferase activity, and are expressed as Relative Luminescence Units. P = promoter. Each point is the mean ± SEM of three experiments. * = Significantly different from the P2 and P3 values (P < 0.001).
Figure 2
Figure 2. Effect of 1,25D on PTHrP promoter activity mediated via P1, P2 or P3 in C4-2 and PC-3 cells
Cells were transfected with the indicated promoter-driven luciferase reporter constructs plus Renilla luciferase construct, then treated with the indicated concentration of 1,25D or with ethanol (V, vehicle control). Luciferase activity was measured after 24 h. Empty vector control values were subtracted from the respective firefly and Renilla luciferase values. Values were then normalized to Renilla luciferase activity, and are expressed as the Firefly/Renilla ratio. P = promoter. Each bar is the mean ± SEM of three experiments. * = Significantly different from the vehicle control (P < 0.001).
Figure 3
Figure 3
(A) Decay profile of PTHrP mRNA in PC-3 cells treated with 1,25D or ethanol The cells were treated with 1,25D (10−7 M) or ethanol (EtOH, vehicle control) for 48 h, followed by the transcriptional inhibitor 5,6-dichlororibofuranosylbenzimidazole (DRB). PTHrP mRNA levels were measured by reverse transcription/real-time PCR at the indicated time points after addition of DRB, and are expressed as a percentage of the value obtained at the time of DRB addition (0 h), set at 100%. Each point represents the mean ± S.E.M. of three independent experiments. (B) Comparison of the PTHrP mRNA half-life in 1,25D- and ethanol-treated cells. The values were obtained from the data presented in (A). * = Significantly different from the vehicle control value (P < 0.001).
Figure 4
Figure 4. Effect of 1,25D on PTHrP protein levels, analyzed by Western blot analysis. (A and B) PTHrP levels in PC-3 and C4-2 cells treated with the indicated concentrations [log[(M)] of 1,25D
After 48 h, lysates were prepared for Western blotting. (A) Representative Western blot. (B) The relative PTHrP levels were obtained after densitometric scanning of the Western blots and normalization to GAPDH. The control value (−, ethanol treated cells) was set at 100%. In PC-3 cells, only the major band was analyzed. In C4-2 cells, only one band was evident. Each bar represents the mean ± S.E.M. of three independent experiments. * = Significantly different from the vehicle control (P < 0.001). (C) Recovery of PTHrP expression in PC-3 cells treated with 1,25D or ethanol. Lane 1, PTHrP levels in cells treated with 10−7 M 1,25D for 72 h; lane 2, PTHrP levels in cells treated with the protein synthesis inhibitor cycloheximide (CHX) for 6 h; lane 3, PTHrP levels in control (ethanol-treated) cells. Lanes 4–15. PC-3 cells were pre-treated with CHX for 6 h, then with 10−7 M 1,25D (+ 1,25D lanes) or with ethanol (vehicle control; − 1,25D lanes). At the indicated time points, lysates were prepared for Western blotting. The relative PTHrP levels were obtained after densitometric scanning of the Western blots and normalization to GAPDH. The control value (−, ethanol treated cells) was set at 100%. The mean and S.E.M. values represent data from three independent experiments.
Figure 5
Figure 5
(A) Time course for VDR depletion in cells treated with 1,25D or ethanol (vehicle control) Cells were pretreated with the protein synthesis inhibitor cycloheximide (CHX) for 30 min, then with 1,25D (10 −7M) in the presence or absence of the proteasome inhibitor MG132 (50 µM). Ethanol (EtOH) and DMSO were used as vehicle controls for 1,25D and MG132, respectively. Nuclear extracts were prepared at the indicated time points for Western blotting. (B–D) Effects of suppressing VDR expression on levels of the VDR (B,C) and of the 1,25D target gene CYP24a1 (D). VDR expression was suppressed by transfection with siRNA targeting the VDR. (B, D) VDR and CYP24a1 mRNA levels were analyzed by reverse transcription/real-time PCR analysis. Each bar is the mean ± SEM of three experiments for each of two independent non-target control siRNAs (NTC), VDR-targeting siRNAs (VDR si), or non-transfected control (−). (C) Western blot analysis for VDR levels in VDR siRNA-transfected cells. (E) Recovery of PTHrP expression in cells with suppressed VDR expression treated with 1,25D or ethanol. PC-3 cells transfected with an siRNA targeting the VDR (VDR si +) were pre-treated with the protein synthesis inhibitor cycloheximide (CHX) for 6 h, then with 1,25D (10−7 M) (+ 1,25D lanes) or with ethanol (vehicle control; − 1,25D lanes). − VDR si lanes were transfected with NTC siRNA. After 48 h, lysates were prepared for Western blotting. In (A), (C) and (E), the relative PTHrP levels were obtained after densitometric scanning of the Western blots and normalization to GAPDH. The control value (−, ethanol treated cells) was set at 100%. In (A), (C) and (E), the mean and S.E.M. values represent data from three independent experiments.
Figure 6
Figure 6. Effect of 1,25D on the PTHrP protein half-life
PC-3 cells were treated with 1,25D (10−7 M) or ethanol (EtOH, vehicle control) for 48 h. The protein synthesis inhibitor CHX (150 µg/ml) was then added. At the indicated time points, lysates were prepared for Western blotting. (A) Representative Western blot showing decay of PTHrP levels in 1,25D- or ethanol-treated cells co-treated with CHX. (B) Densitometric analysis of the decay of PTHrP levels after CHX treatment in cells pre-treated with 1,25D or ethanol. Each point is the mean ± SEM of data from three independent experiments. The 0 time-point (at the time of CHX addition) is set at 100%. (C) Comparison of halflife of PTHrP in 1,25D- and ethanol-treated cells. The values were obtained from the data presented in (B). * = Significantly different from the vehicle control value (P < 0.001).

References

    1. Abe M, Akeno N, Ohida S, Horiuchi N. Inhibitory effects of 1,25-dihydroxyvitamin D3 and 9-cis-retinoic acid on parathyroid hormone-related protein expression by oral cancer cells (HSC-3) J. Endocrinol. 1998;156:349–357. - PubMed
    1. Alizadeh M, Gelfman GM, Bench SR, Hjelmeland LM. Expression and splicing of FGF receptor mRNAs during ARPE-19 cell differentiation in vitro. Invest. Ophthalmol. Vis. Sci. 2000;41:2357–2362. - PubMed
    1. Berruti A, Piovesan A, Torta M, Raucci CA, Gorzegno G, Paccotti P, Dogliotti L, Angeli A. Biochemical evaluation of bone turnover in cancer patients with bone metastases: Relationship with radiographic appearances and disease extension. Br. J. Cancer. 1996;73:1581–1587. - PMC - PubMed
    1. Bhatia V, Saini MK, Shen X, Bi LX, Qiu S, Weigel NL, Falzon M. EB1089 inhibits the PTHrP-enhanced bone metastasis and xenograft growth of human prostate cancer cells. Mol. Cancer Ther. 2009;8:1787–1798. - PMC - PubMed
    1. Bird AP. CpG-rich islands and the function of DNA methylation. Nature. 1986;321:209–213. - PubMed

Publication types

MeSH terms