Review
. 2011 Nov;1811(11):976-90.
doi: 10.1016/j.bbalip.2011.05.007. Epub 2011 May 27.

Lipid imaging with time-of-flight secondary ion mass spectrometry (ToF-SIMS)

Affiliations
Review

Lipid imaging with time-of-flight secondary ion mass spectrometry (ToF-SIMS)

Melissa K Passarelli et al. Biochim Biophys Acta. 2011 Nov.

Abstract

Fundamental advances in secondary ion mass spectrometry (SIMS) now allow for the examination and characterization of lipids directly from biological materials. The successful application of SIMS-based imaging in the investigation of lipids directly from tissue and cells are demonstrated. Common complications and technical pitfalls are discussed. In this review, we examine the use of cluster ion sources and cryogenically compatible sample handling for improved ion yields and to expand the application potential of SIMS. Methodological improvements, including pre-treating the sample to improve ion yields and protocol development for 3-dimensional analyses (i.e. molecular depth profiling), are also included in this discussion. New high performance SIMS instruments showcasing the most advanced instrumental developments, including tandem MS capabilities and continuous ion beam compatibility, are described and the future direction for SIMS in lipid imaging is evaluated.


Figures

Fig. 1
Fig. 1
The diagram describes overlaps and unique areas of MALDI, DESI and SIMS. Lipids are detectable in all three methodologies.
Fig. 2
Fig. 2
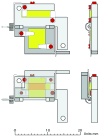
Bird’s eye view (left) and profile (right) of freeze fracturing device in the closed position (bottom) before a fracture and opened (top) position after a fracture. (Note: Yellow areas = silicon shards) [44]
Fig. 3
Fig. 3
Sagittal section of rat brain. (Top row, left to right) SIMS images obtained in the positive mode—phosphocholine headgroup (m/z 184), cholesterol (m/z 385) and m/z 796.8—and optical image of the tissue. (bottom row: left to right) SIMS images obtained in the negative mode—Stearic (18:0) fatty acid fragment (m/z 283), vitamin E (m/z 429.3) and sulfoglycosphingolipid (sulfitide, d18:1/24:1)—and the overlay of these ions. [fatty acid (red), vitamin E (green) and sulfitide (blue)[61]
Fig. 4
Fig. 4
Negative ToF-SIMS images of cerebellum tissue (a) summed pixel intensities of sulfatides from m/z 778.5 to 934.6 red (b) ion intensities of cholesterol at m/z 385 green and (c) overlay of panels a and b. Regions of the cerebellum are outlined; molecular layers (m), white matter (w) and the gray mater (g). [66]
Fig. 4
Fig. 4
Negative ToF-SIMS images of cerebellum tissue (a) summed pixel intensities of sulfatides from m/z 778.5 to 934.6 red (b) ion intensities of cholesterol at m/z 385 green and (c) overlay of panels a and b. Regions of the cerebellum are outlined; molecular layers (m), white matter (w) and the gray mater (g). [66]
Fig. 5
Fig. 5
Microscopy (DIC) image of a mating tetrahymena thermophila (a) and SIMS image depicting localizations of an ubiquitous organic ion at m/z 69 (C5H9, b). Lipid heterogeneities at the mating junction includes a depletion of phosphocholine (c) and an accumulation of 2-AEP (d). (Scale bar: 25 μm) [85]
Fig. 6
Fig. 6
SIMS images of a cultured neuron obtained from the superior cervical ganglia of a mouse. Ion contribution from the phosphocholine headgroup (m/z 206.1, m/z 224.1 and m/z 246.1) is distinguished from the SM headgroup (m/z 206.1) fragments. [90]
Fig. 7
Fig. 7
3D biochemical images of freeze-dried oocyte depicting phosphocholine signal from m/z 58, 86, 166, and 184 (a) and cholesterol signal at m/z 369 (d). [96]
Fig. 7
Fig. 7
3D biochemical images of freeze-dried oocyte depicting phosphocholine signal from m/z 58, 86, 166, and 184 (a) and cholesterol signal at m/z 369 (d). [96]
Fig. 8
Fig. 8
Image acquired with dynamic SIMS, illustrates the distribution of isotopically traceable monosaturated fatty acid, oleate, in a single 3T3F442A adipocyte [97]. The oleate is localized to the cell membrane and discrete lipid droplets inside the cell.
Fig. 9
Fig. 9
Schematic of the C60+ QStar instrument shows how the commercial triple quadrupole orthogonal ToF mass spectrometer was interfaced with a C60 ion source. [101]
Fig. 10
Fig. 10
Lipid profile obtained from a single neuron with SIMS (a) and from a compilation of neurons with MALDI (b). The tandem MS spectrum shows that m/z 709 and 184 are major fragments of m/z 768.5, the sodiated adduct of major lipid component m/z 746.5 (c). Optical image (d, left) and black and white SIMS total ion image (d, right) of cultured aplysia neuron on silicon wafer (image size 2.00 × 4.75 mm). [102]
Fig. 11
Fig. 11
Schematic of Ionoptika J105 3D Chemical Imager (a) and close up diagram of time focusing buncher, collision cell for tandem MS acquisitions and ToF mass analyze (b). [100]
Fig. 12
Fig. 12
3D biochemical images of frozen hydrated HeLa M cells depicting localizations of phosphocholine headgroup (m/z 184, green) on the cell membranes and adenine (m/z 136.1, red) localized to the nucleus obtained on the Ionoptika J105 3D Chemical Imager. [22, 103]

References

    1. Braun RM, Beyder A, Xu JY, Wood MC, Ewing AG, Winograd N. Spatially resolved detection of attomole quantities of organic molecules localized in picoliter vials using time-of-flight secondary ion mass spectrometry. Analytical Chemistry. 1999;71:3318–3324. - PubMed
    1. Kollmer F. Cluster primary ion bombardment of organic materials. Applied Surface Science. 2004;231:153–158.
    1. Fuchs B, Suss R, Schiller J. An update of MALDI-TOF mass spectrometry in lipid research. Prog Lipid Res. 2010;49:450–475. - PubMed
    1. Murphy RC, Hankin JA, Barkley RM. Imaging of lipid species by MALDI mass spectrometry. J Lipid Res. 2009;50:S317–S322. - PMC - PubMed
    1. Sullards MC, Chen Y, Liu Y, Merrill AH. Imaging of lipids directly from brain tissue via matrix assisted laser desorption ionization Time-of-Flight Mass Spectrometry (MALDI TOF MS) J Neurochem. 2010;113:92. - PubMed

Publication types

LinkOut - more resources