. 2011 Jun 24;145(7):1142-55.
doi: 10.1016/j.cell.2011.05.024. Epub 2011 Jun 16.

In vivo clonal analysis reveals self-renewing and multipotent adult neural stem cell characteristics

Affiliations

In vivo clonal analysis reveals self-renewing and multipotent adult neural stem cell characteristics

Michael A Bonaguidi et al. Cell. .

Abstract

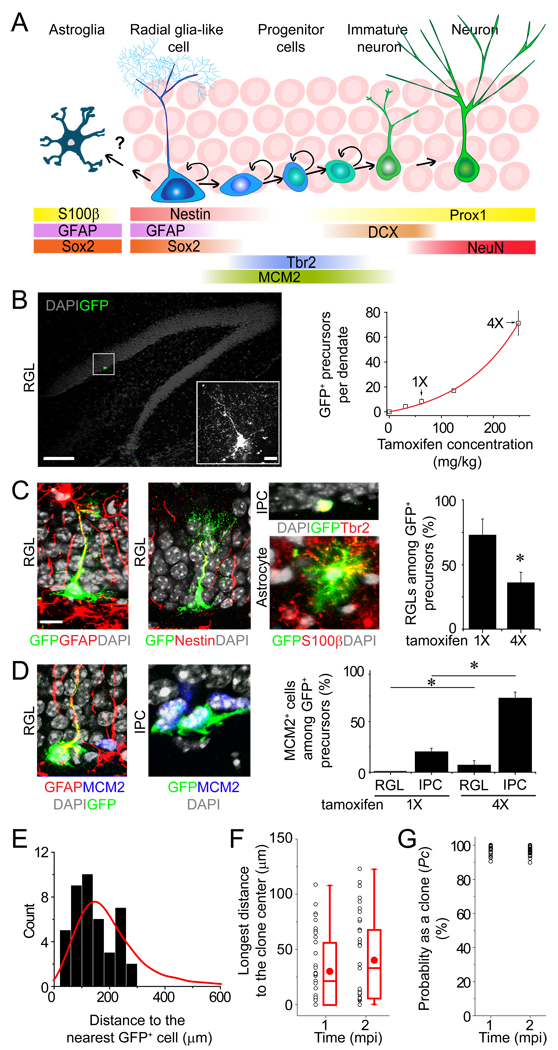
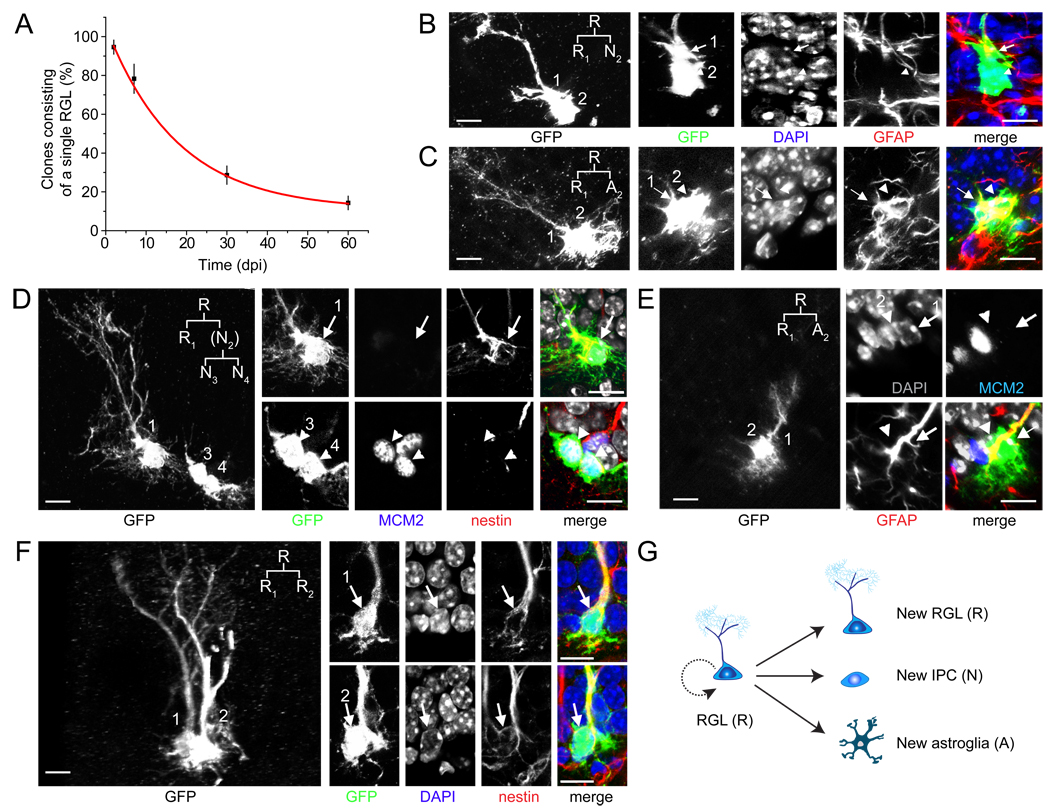
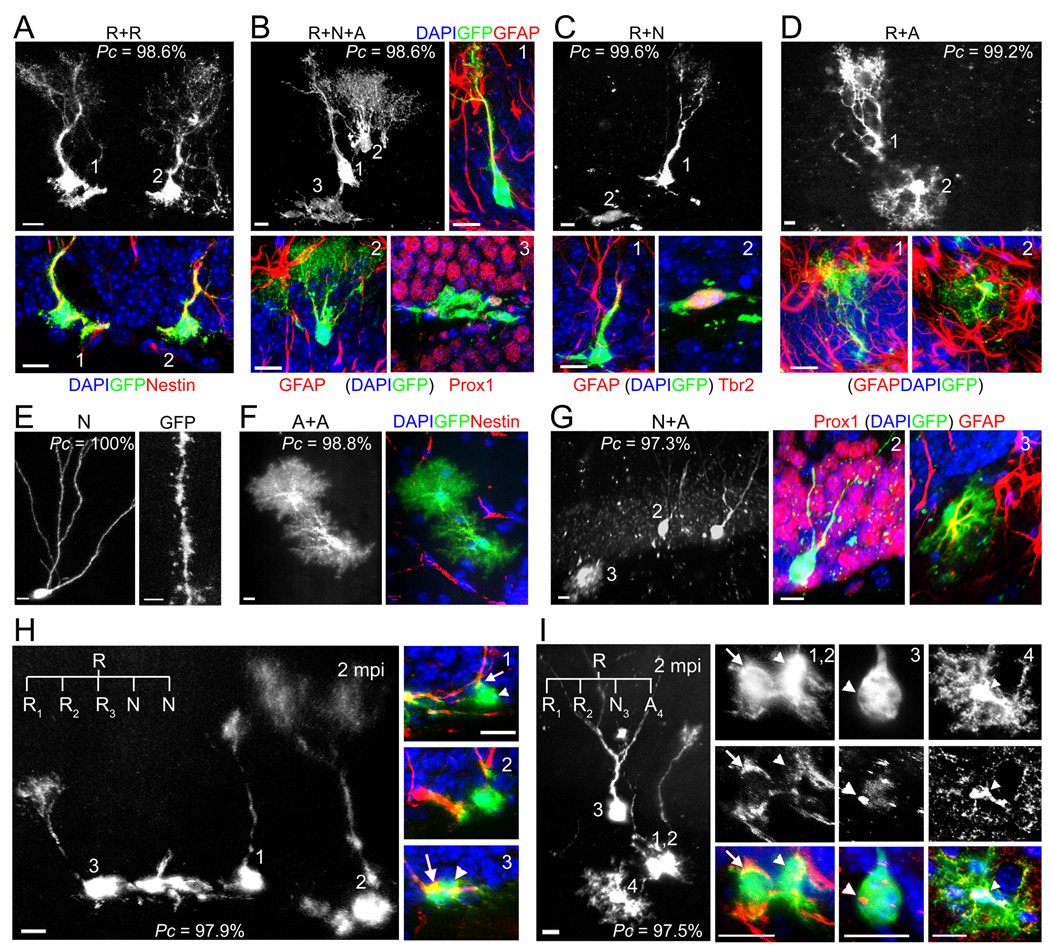
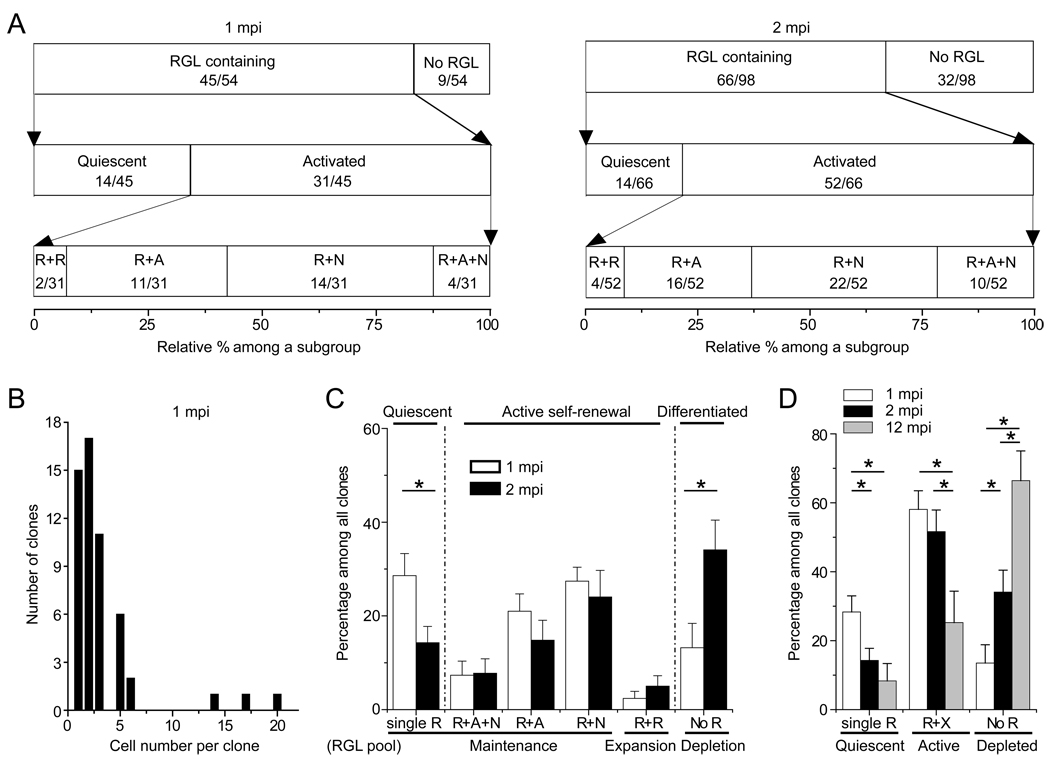
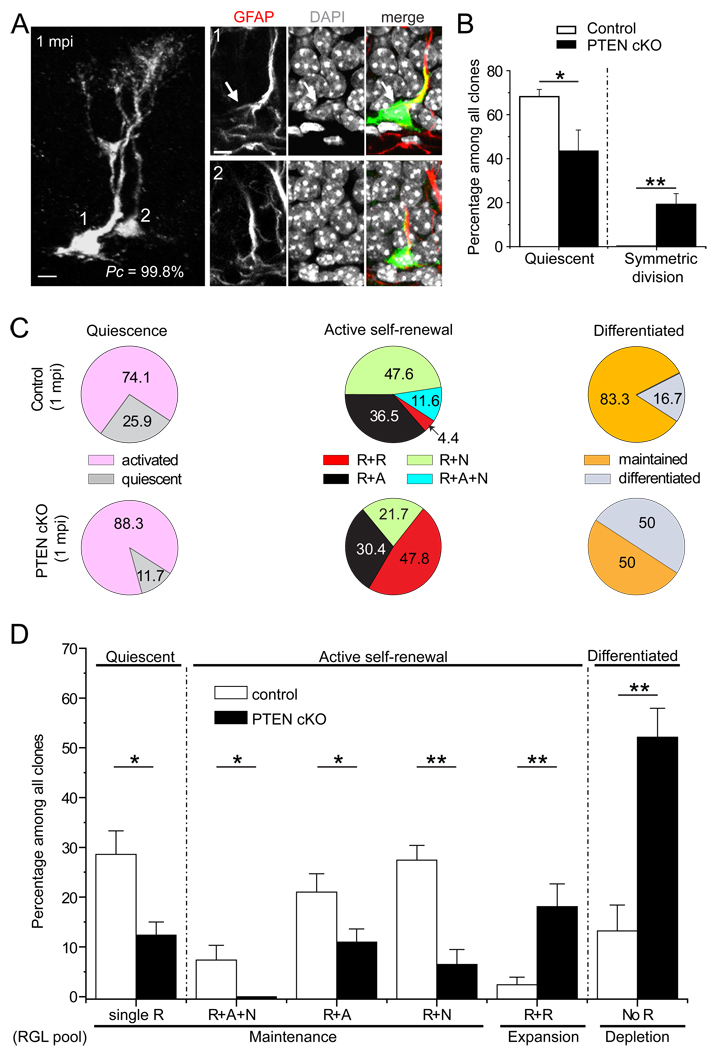
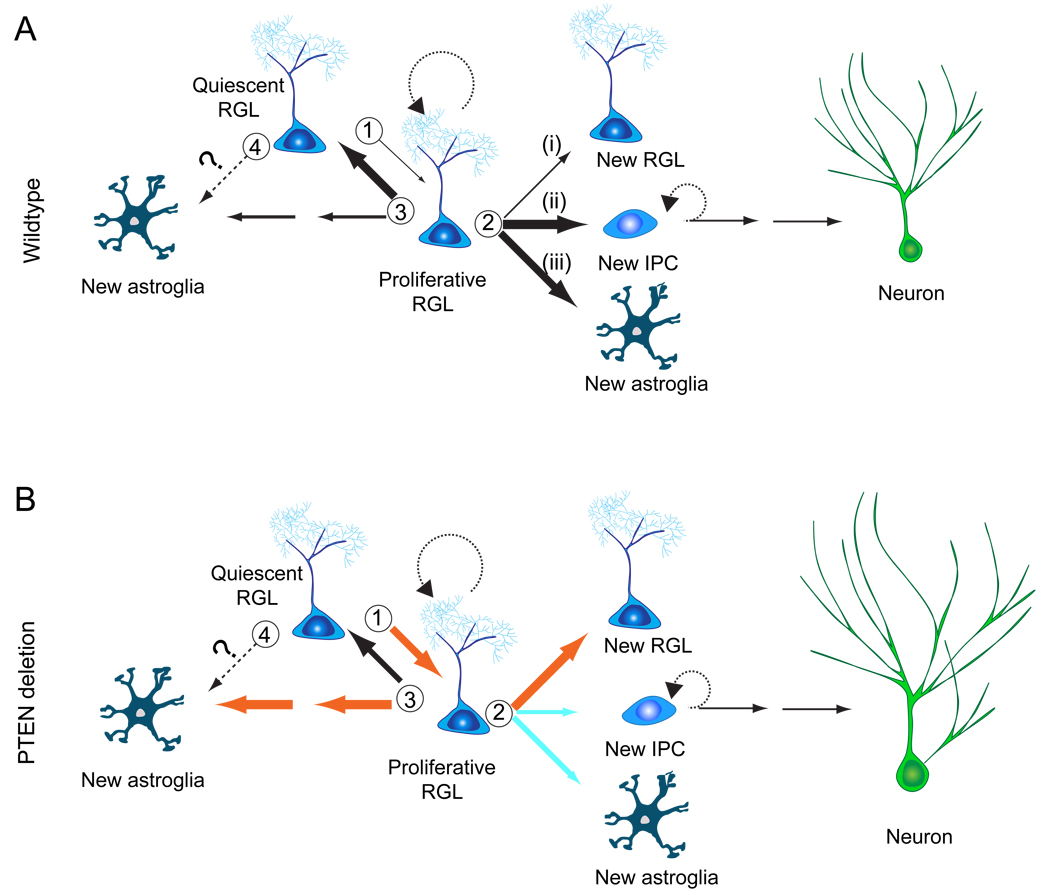
Neurogenesis and gliogenesis continue in discrete regions of the adult mammalian brain. A fundamental question remains whether cell genesis occurs from distinct lineage-restricted progenitors or from self-renewing and multipotent neural stem cells in the adult brain. Here, we developed a genetic marking strategy for lineage tracing of individual, quiescent, and nestin-expressing radial glia-like (RGL) precursors in the adult mouse dentate gyrus. Clonal analysis identified multiple modes of RGL activation, including asymmetric and symmetric self-renewal. Long-term lineage tracing in vivo revealed a significant percentage of clones that contained RGL(s), neurons, and astrocytes, indicating capacity of individual RGLs for both self-renewal and multilineage differentiation. Furthermore, conditional Pten deletion in RGLs initially promotes their activation and symmetric self-renewal but ultimately leads to terminal astrocytic differentiation and RGL depletion in the adult hippocampus. Our study identifies RGLs as self-renewing and multipotent neural stem cells and provides novel insights into in vivo properties of adult neural stem cells.


Figures

Figure 1
Figure 1. A genetic marking strategy for in vivo analysis of individual nestin+ radial glia-like neural precursors in the adult mouse dentate gyrus
(A) A schematic diagram indicating the current view of lineage relationships and marker expression during adult hippocampal neurogenesis. (B) Tamoxifen dose responses on the number of labeled precursors in the dentate gyrus of adult nestin-CreERT2;Z/EG mice. Shown is a sample projected confocal image of GFP and DAPI. Scale bar: 100 µm (10 µm for the insert). Also shown is a summary of the number of GFP+ precursors in each dentate gyrus. Values represent mean ± SD (n = 5–12 dentate gyri). (C and D) Characteristics of labeled cells 2 days after induction with 1X or 4X dose of tamoxifen. In (C), shown are sample confocal images of immunostaining of GFP, GFAP or nestin (for RGL), Tbr2 (for IPC), and S100β (for mature astrocyte), and a summary of the percentage of GFP+ cells with RGL characteristics among all labeled precursors within the adult subgranular zone. Values represent mean ± SEM (n = 5; *: P < 0.05; Student’s t-test). In (D), shown are sample confocal images of immunostaining of MCM2 and the percentage of GFP+ precursor subtypes that were MCM2+. Value represent mean ± SEM (n = 3; *: P < 0.05; Student’s t-test). Scale bars: 10 µm. (E to G) Quantitative analysis of clonality at 1 and 2 mpi after induction with the 1X dose of tamoxifen. Shown in (E) is the distribution of measured distances between a GFP+ precursor and its nearest GFP+ cell in the dentate gyrus at 2 dpi (histogram) and data from a computer simulated distribution of distances (8 precursors and 14 astroglia; red line). Shown in (F) is a summary of measured longest distance of a GFP+ cell to the clone center at 1 and 2 mpi. Each dot represents data from one clone. Also shown are box-plots (middle dot represents mean; middle line represents median; box represents 25th to 75th percentile; whiskers are minimum and maximum values). Shown in (G) is the calculated probability as a clone (Pc) for each cell cluster based on distance measurements in (F) and standard curves in Figure S1C.
Figure 2
Figure 2. Different modes of self-renewal by individual RGLs in the adult dentate gyrus
(A) Time course of activation of labeled RGLs in the adult dentate gyrus after induction with the 1X dose of tamoxifen. Shown is the quantification of clones consisting of a single RGL, indicating quiescence. Values present mean ± SEM (n = 3–8 animals). (B–F) Sample confocal images of GFP+ cells in the process of, or right after RGL cell division (Pc ≥ 99.8%). Shown are samples of neurogenic asymmetric cell division (B, D), astrogenic asymmetric cell division (C, E) and symmetric cell division (F). The potential lineage relationship is indicated in the insert. R: RGL; N: neuronal lineage; A: astroglia. Note that after cell division, the RGL and newborn astroglia returned to quiescence (MCM2; D, E), whereas the IPC re-entered the cell cycle (MCM2+; D). Scale bars: 10 µm. (G) A schematic diagram of three modes of self-renewal made by an RGL in the adult dentate gyrus.
Figure 3
Figure 3. Clone classifications after long-term lineage-tracing of individual RGLs in the adult dentate gyrus
(A–D) Sample confocal images of clones with active self-renewal. The clone in (A) consisted of two nestin+ RGLs, but no other cells, indicating symmetric self-renewal and an expansion of the RGL pool. The clone in (B) consisted of a GFAP+ RGL (1), a GFAP+ bushy astrocyte (2) and a cluster of 18 cells of the neuronal lineage (3), some of which expressed dentate granule cell marker Prox1, indicating self-renewal and multi-lineage differentiation (See 3D reconstruction in Movie S2). The clone in (C) consisted of a GFAP+ RGL (1) and Tbr2+ IPCs (2), indicating self-renewal and unipotential neurogenic differentiation. The clone in (D) consisted of a GFAP+ RGL (1) and a GFAP+ bushy astrocyte (2), indicating self-renewal and unipotential astrogenic differentiation. The Pc value for each clone is also shown. Scale bars: 10 µm. (E–G) Sample confocal images of differentiated clones without an RGL. The clone in (E) consisted of a mature neuron with prominent dendritic spines (Scale bar: 2 µm). The clone in (F) consisted of two nestin bushy astrocytes. The clone in (G) consisted of two Prox1+ neurons (2) and one GFAP+ stellate astrocyte (3). Scale bars: 10 µm. (H) Sample confocal images of a clone indicating multiple rounds of self-renewal within two months. The clone consists of three nestin+ RGLs (1, 2, 3) and two IPCs. Scale bars: 10 µm. The potential lineage relationship is illustrated in Figure S3A. (I) Sample confocal images of a clone indicating multiple modes of self-renewal and multi-lineage differentiation within the two month period, including symmetric, neurogenic asymmetric and astrogliogenic asymmetric self-renewal. The clone consisted of two nestin+ RGLs (1, 2), one Prox1+ mature neuron with elaborate dendritic arborization (3), and one S100β+ stellate astrocyte (4). Scale bars: 10 µm. The potential lineage relationship is illustrated in Figure S3B.
Figure 4
Figure 4. Summary of clone properties at different time points after labeling
(A) Quantification of the frequency of different types of clones at 1 and 2 mpi after induction with 1X dose of tamoxifen. Data represent the relative frequency among a defined subgroup of clone categories. The number of a specific type and total number of clones within a subgroup are indicated in parenthesis. R:RGL; A: astroglia; N: neuronal lineage. (B) A histogram of the number of progeny within each clone at 1 mpi. (C) Quantitative comparison of the frequency of different clone compositions observed at 1 and 2 mpi. The frequency of each type among all clones per dentate gyrus is plotted for comparison using the same dataset as in (A). R: RGL; A: astroglia; N: neuronal lineage. Values represent mean ± SEM (*: P < 0.05; student’s t-test; n = 7 and 13 dentate gyri for 1 and 2 mpi, respectively). (D) Quantitative comparison of the frequency of clones with quiescent (single R), clones with activated RGLs (R+X), and clones depleted of RGLs (No R) at 1, 2 and 12 mpi. The same dataset as in (A) is used for 1 and 2 mpi. For 12 mpi, animals were induced with 0.5X dose of tamoxifen (n = 7 dentate gyri). Values represent mean ± SEM (*: P < 0.05; student’s t-test).
Figure 5
Figure 5. MADM-based analysis of nestin+ radial glia-like neural precursors in the adult brain
(A) A schematic diagram indicating potential color combinations from the MADM-based reporter depending on the timing of the Cre-mediated recombination. G2-X phase recombination leads to two color labeling of two daughter cells and all their progeny from a single mitotic event, whereas G1/G0 phase recombination only generates GFP+RFP+ (yellow) clones. (B) Tamoxifen dose responses on the number of labeled precursors in the dentate gyrus of adult nestin-CreERT2;MADM mice at 2 dpi. Values represent mean ± SD (n = 3 dentate gyri). (C) Sample projection confocal images of a single RGL labeled with both GFP and RFP in the adult dentate gyrus. Scale bars: 100 µm (10 µm for the insert). (D) A summary of probability as a clone (Pc) for all labeled cell clusters in the MADM study. The probability was calculated based on the computational simulation (in Figure S1C) and direct distance measurement of the longest distance from progeny to the clone center (Figure S5C). (E) Sample confocal images of a clone indicating self-renewal and multi-lineage differentiation within the two month window. Shown are confocal images of a clone consisting of a GFAP+ RGL (1), an immature neuron (2), a GFAP+ bushy astrocyte (3), and a cluster of IPCs (4), and diagrams of the potential lineage relationship. Scale bars: 10 µm. (F) Comparison of the frequency of clone compositions observed at 2 mpi between Z/EG (n = 98 clones; same as in Figure 4A) and MADM reporters (n = 23 clones). The frequency of each type among clones from all animals is plotted. R: RGL; A: astroglia; N: neuronal lineage.
Figure 6
Figure 6. Roles of PTEN in regulating quiescence, self-renewal modes and differentiation of RGLs in the adult dentate gyrus
(A) Sample confocal images of a clone consisting of two RGLs with Pten deletion at 1 mpi. Scale bars: 10 µm. (B) Rapid activation and symmetric self-renewal of RGLs after Pten deletion in individual RGLs. Shown is the quantification of quiescence and symmetric self-renewal of RGLs in control (n = 6) and PTEN cKO mice (n = 5) at 2 dpi. Values represent mean ± SEM (**: P < 0.01; *: P < 0.05; student’s t-test). (C and D) Quantitative comparison of the frequency of different clone types between control (n = 7) and PTEN cKO (n = 6) at 1 mpi. Shown are pie charts of the relative frequency among each category (C) and the summary of the frequency of different types among all clones (D). The detailed analysis of differentiated clones is shown in Figure S6G. R: RGL, A: astroglia, N: neuronal lineage. Values represent mean ± SEM (**: P < 0.01; *: P < 0.05; student’s t-test).
Figure 7
Figure 7. Models of nestin+ radial glia-like neural stem cell behavior in the adult hippocampus under basal conditions and after Pten deletion
(A) A model of the lineage relationship of RGLs in the young adult mouse hippocampus under basal conditions. There are at least three critical choice points: (1) An RGL decides to remain in quiescence or to become activated and enter the cell cycle; (2) An activated RGL can undergo one of three modes of self-renewal: (i) symmetric self-renewal to expand the RGL pool; (ii) neurogenic or (iii) astrogliogenic asymmetric self-renewal to generate a differentiated progeny while maintaining the RGL pool; (3) The RGL makes a choice between returning to quiescence and maintaining stemness or differentiating into an astrocyte via transition astroglia. (4) It is also possible that a quiescent RGL can directly differentiate into an astrocyte without cell division. The thickness of the arrow indicates the relative probability of each choice. (B) A model on the role of PTEN in regulating RGLs in the young adult mouse hippocampus. Pten deletion in an RGL rapidly mobilizes it into cell cycle and fosters symmetric self-renewal. Over the long-term, PTEN loss promotes terminal differentiation of RGLs into astrocytes. PTEN loss in newborn neurons also leads to increased soma size and dendritic complexity. Orange and blue arrows indicate increased and decreased probability, respectively.

Comment in

References

    1. Altman J, Das GD. Post-natal origin of microneurones in the rat brain. Nature. 1965;207:953–956. - PubMed
    1. Balordi F, Fishell G. Mosaic removal of hedgehog signaling in the adult SVZ reveals hat the residual wild-type stem cells have a limited capacity for self-renewal. J Neurosci. 2007;27:14248–14259. - PMC - PubMed
    1. Bronner-Fraser M, Fraser SE. Cell lineage analysis of the avian neural crest. Development. 1991 Suppl 2:17–22. - PubMed
    1. Brunne B, Zhao S, Derouiche A, Herz J, May P, Frotscher M, Bock HH. Origin, maturation, and astroglial transformation of secondary radial glial cells in the developing dentate gyrus. Glia. 2010;58:1553–1569. - PMC - PubMed
    1. Carlen M, Meletis K, Goritz C, Darsalia V, Evergren E, Tanigaki K, Amendola M, Barnabe-Heider F, Yeung MS, Naldini L, et al. Forebrain ependymal cells are Notch-dependent and generate neuroblasts and astrocytes after stroke. Nat Neurosci. 2009;12:259–267. - PubMed

Publication types