. 2011 May;19(2):323-37.
doi: 10.1016/j.mric.2011.02.002.

MR imaging assessment of articular cartilage repair procedures

Affiliations

MR imaging assessment of articular cartilage repair procedures

Gregory Chang et al. Magn Reson Imaging Clin N Am. 2011 May.

Abstract

Because articular cartilage is avascular and has no intrinsic capacity to heal itself, physical damage to cartilage poses a serious clinical problem for orthopedic surgeons and rheumatologists. No medication exists to treat or reconstitute physical defects in articular cartilage, and pharmacotherapy is limited to pain control. Developments in the field of articular cartilage repair include microfracture, osteochondral autografting, osteochondral allografting, repair with synthetic resorbable plugs, and autologous chondrocyte implantation. MR imaging techniques have the potential to allow in vivo monitoring of the collagen and proteoglycan content of cartilage repair tissue and may provide useful additional metrics of cartilage repair tissue quality.


Conflict of interest statement

The authors have no financial disclosures.

Figures

Fig. 1
Fig. 1
A 55-year-old man who underwent microfracture repair. (A) Preoperative, axial, T2-weighted, fat-suppressed, 3-T MR imaging of the knee demonstrates a full-thickness cartilage defect within the lateral femoral trochlea (arrow) with extensive surrounding bone marrow edema. (B) Three-month postoperative, axial, T2-weighted, fat-suppressed, 3-T MR imaging demonstrates partial filling of the defect with fibrocartilage (arrow), which has an irregular surface and demonstrates fissuring. There is also decreased surrounding bone marrow edema. (C) Six-month postoperative, axial, 3-D, gradient-echo, T1-weighted, fat-suppressed, 7-T MR imaging (0.234 mm × 0.234 mm × 1 mm) shows slightly irregular fibrocartilage filling the defect (arrowhead) which has similar signal intensity characteristics to the adjacent native hyaline cartilage. (D) Six-month postoperative, axial, 7-T, sodium MR imaging reveals apparent decreased sodium signal (and thus proteoglycan content) within the fibrocartilage (arrowhead). Note the higher sodium signal within the adjacent native hyaline cartilage. Sodium chloride phantoms are seen at the medial aspect of the knee.
Fig. 2
Fig. 2
A 54-year-old woman who underwent microfracture repair. (A) Preoperative, coronal, T2-weighted, fat-suppressed, 3-T MR imaging of the knee reveals a full-thickness cartilage defect within the posterior weight-bearing aspect of the lateral femoral condyle (arrow). (B) Six-month postoperative, coronal, T2-weighted, fat-suppressed, 3-TMR imaging shows partial filling of the defect with fibrocartilage (line) that is heterogeneous in signal intensity.
Fig. 3
Fig. 3
A 37-year-old woman who underwent osteochondral autografting. (A) Preoperative, sagittal, T2-weighted, fat-suppressed, 3-T MR imaging of the ankle demonstrates an osteochondral lesion of the medial talar dome (arrow). There is cartilage damage, mild cortical depression, and subchondral edema/cyst formation. (B) Six-month postoperative, sagittal, T2-weighted, fat-suppressed, 3-T MR imaging shows restoration of the talar dome, including a thin layer of overlying cartilage (arrowhead) with similar signal characteristics to adjacent native hyaline cartilage and mild perigraft edema (arrow).
Fig. 4
Fig. 4
A 27-year-old woman who underwent osteochondral autografting. (A) Preoperative, coronal, T2-weighted, fat-suppressed, 3-T MR imaging of the knee shows a full-thickness cartilage defect within the weight-bearing aspect of the medial femoral condyle (arrow) with surrounding subchondral bone marrow edema. (B) Three-month postoperative, sagittal, T2-weighted, fat-suppressed, 3-T MR imaging shows removal of two osteochondral plugs from the lateral femoral trochlea (arrow). (C) Three-month postoperative, sagittal, T2-weighted, fat-suppressed, 3-T MR imaging shows marrow hyperintensity surrounding the transplanted osteochondral autografts (bracket). This perigraft edema later decreased at 6-month follow-up.
Fig. 5
Fig. 5
A 19-year-old man who underwent osteochondral autografting. (A) Preoperative, coronal, T2, fat suppressed, 3-T MR image of the knee demonstrates an osteochondral lesion within the weight-bearing aspect of the medial femoral condyle (arrow). (B) Six-month postoperative, sagittal, 3-D, gradient-echo, T1-weighted, fat-suppressed, 7-T MR image (0.234 mm × 0.234 mm × 1 mm) shows an intact osteochondral autograft (arrow) with incorporation into surrounding subchondral bone. (C) Six-month postoperative, sagittal, 7-T, sodium MR image shows no detectable differences in cartilage sodium signal (and thus proteoglycan content) within the osteochondral autograft (arrowhead) when compared with adjacent native hyaline cartilage.
Fig. 6
Fig. 6
A 50-year-old man who underwent osteochondral allografting. (A) Preoperative, sagittal, T2-weighted, fat-suppressed, 3-T, MR image of the knee shows a large full-thickness cartilage defect at the junction of the weight-bearing and posterior aspects of the medial femoral condyle (bracket). (B) Three-month postoperative, sagittal, T2-weighted, fat-suppressed, 3-T MR image shows placement of the osteochondral allograft. The cartilage surface is congruent (arrow), and there is extensive graft and perigraft edema.
Fig. 7
Fig. 7
A 36-year-old woman who was treated with a resorbable synthetic scaffold composed of polyglycolide-polylactide. (A) Preoperative, coronal, T2-weighted, fat-suppressed, 3-T, MR image of the knee shows a near full-thickness cartilage defect at the junction of the weight-bearing and posterior aspects of the lateral femoral condyle (arrow). (B) Seven-month postoperative, sagittal, T2-weighted, fat-suppressed, 3-T MR image shows that the graft is slightly hyperintense (black arrow) when compared with adjacent native hyaline cartilage. The graft remains congruent with the articular surface, and there is no perigraft marrow edema.
Fig. 8
Fig. 8
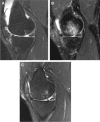
A 41-year-old man who was treated with a resorbable synthetic scaffold composed of polyglycolide-polylactide. (A) Preoperative, sagittal, T2-weighted, fat-suppressed, 3-T MR image of the knee shows a full-thickness cartilage defect within the posterior weight-bearing aspect of the medial femoral condyle (arrow). (B) Three-month postoperative, sagittal, T2-weighted, fat-suppressed, 3-T MR image shows hyperintense signal within and surrounding the graft. The graft does not appear to be congruent with the articular surface, and no overlying hyaline articular cartilage is visible (arrow). (C) Eighteen-month, sagittal, T2-weighted, fat-suppressed, 3-T MR image shows that the degree of intragraft and perigraft edema has greatly decreased. The graft appears to be incorporated into the surrounding subchondral bone, and an overlying layer of hyaline cartilage is visible (arrowhead).
Fig. 9
Fig. 9
A 50-year-old man who underwent ACI for a previously unsuccessful microfracture procedure. (A) Preoperative, sagittal, T2-weighted, fat-suppressed, 3-T, MR image of the knee shows a full-thickness cartilage defect within the weight-bearing aspect of the medial femoral condyle (arrow). (B) Six-month postoperative, sagittal, T2-weighted, fat-suppressed, 3-T MR image shows the cartilage defect partially filled in with repair tissue. At this stage, the surface of the cartilage repair tissue is slightly irregular (arrowhead), and a small cyst is seen within the subchondral bone marrow deep to the repair tissue (arrow).
Fig. 10
Fig. 10
A 24-year-old man who underwent underwent ACI for a previously unsuccessful microfracture procedure. (A) Preoperative, coronal, T2-weighted, fat-suppressed, 3-T MR image of the knee shows an anterior cruciate ligament reconstruction and irregular fibrocartilage at the weight bearing aspect of the medial femoral condyle in the region of a previous microfracture (arrow). (B) Three-month postoperative, coronal, T2-weighted, fat-suppressed, 3-T MR image shows the cartilage defect partially filled in with hyperintense cartilage repair tissue (black arrow) with mild underlying subchondral bone marrow edema. Incidental note is made of a postsurgical fluid collection at the medial aspect of the knee (arrowhead).

References

    1. Curl W, Krome J, Gordon E, et al. Cartilage injuries: a review of 31,516 knee arthroscopies. Arthroscopy. 1997;13:456–60. - PubMed
    1. Hijelle K, Solheim E, Strand T, et al. Articular cartilage defects in 1000 knee arthroscopies. Arthroscopy. 2002;18:730–4. - PubMed
    1. Mankin H. The response of articular cartilage to mechanical injury. J Bone Joint Surg Am. 1982;64:460–6. - PubMed
    1. Newman A. Articular cartilage repair. Am J Sports Med. 1998;26:309–24. - PubMed
    1. Eckstein F, Burstein D, Link TM. Quantitative MRI of cartilage and bone:degenerative changes in osteoarthritis. NMR Biomed. 2006;19:822–54. - PubMed

Publication types