. 2011 Jun 14;19(6):701-14.
doi: 10.1016/j.ccr.2011.04.017.

Mad2 is a critical mediator of the chromosome instability observed upon Rb and p53 pathway inhibition

Affiliations

Mad2 is a critical mediator of the chromosome instability observed upon Rb and p53 pathway inhibition

Juan-Manuel Schvartzman et al. Cancer Cell. .

Abstract

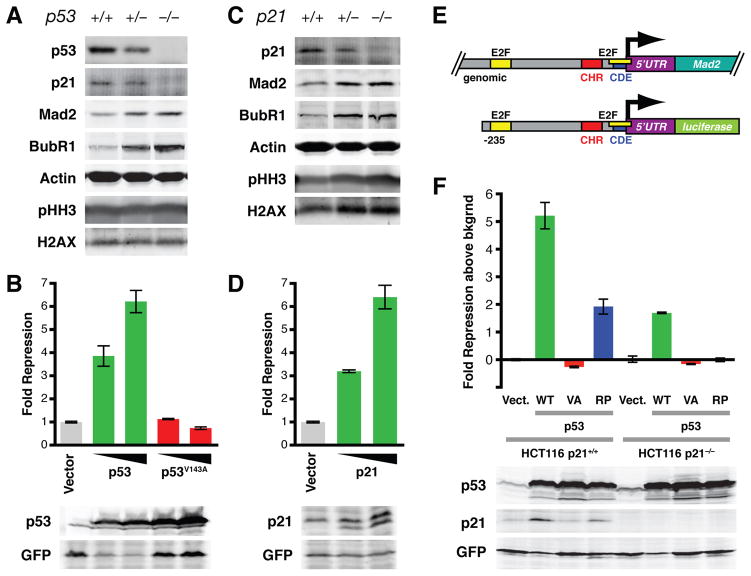
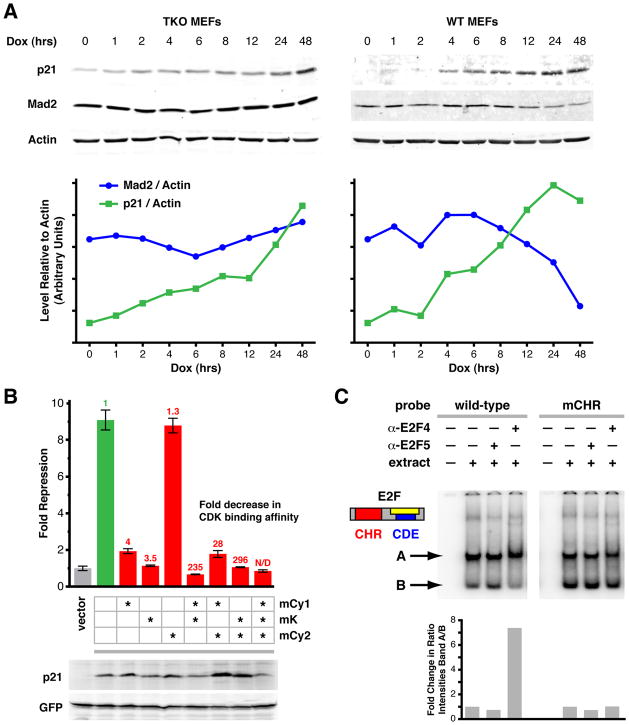
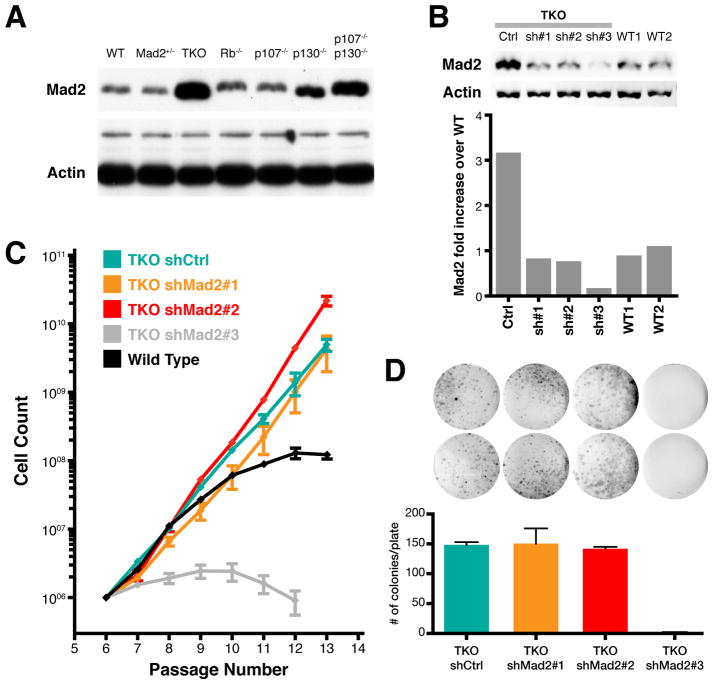
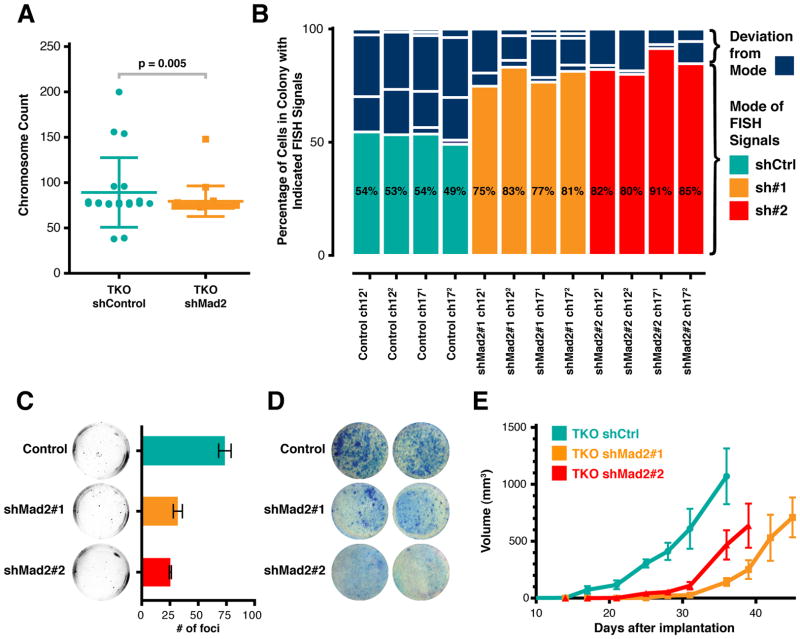
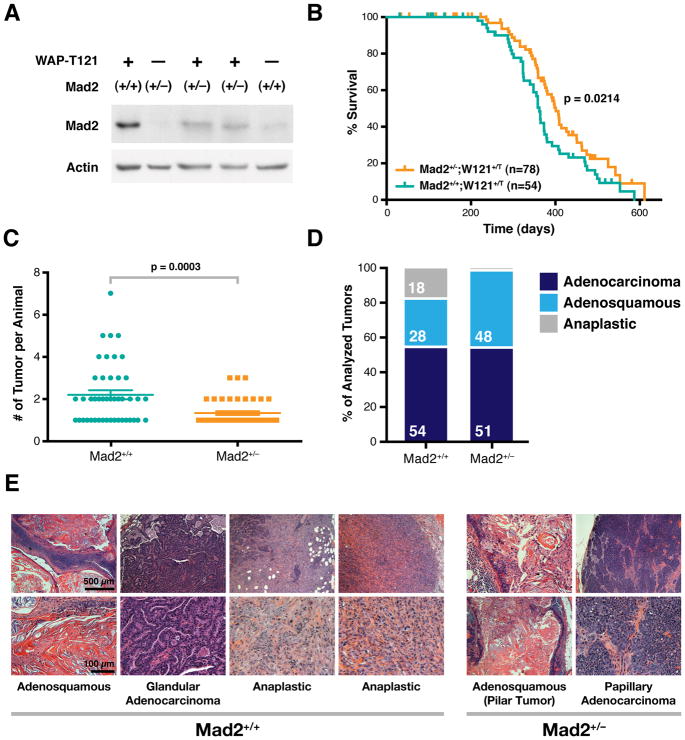
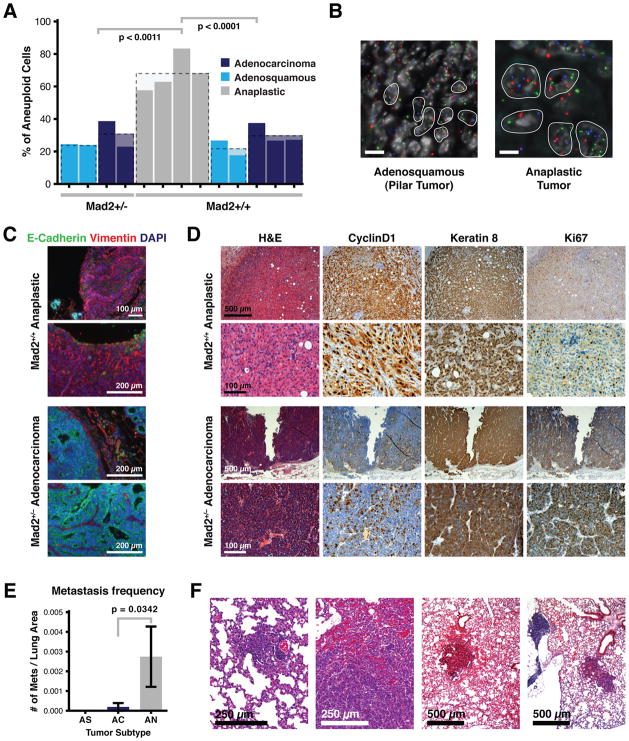
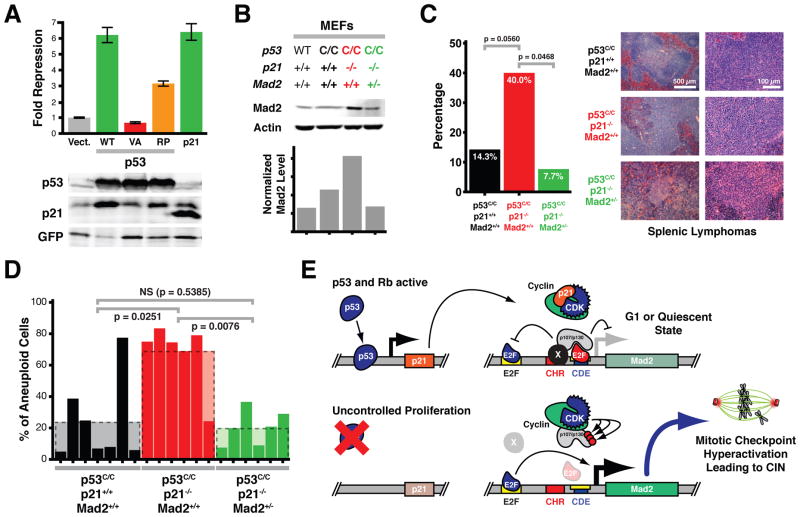
Multiple mechanisms have been proposed to explain how Rb and p53 tumor suppressor loss lead to chromosome instability (CIN). It was recently shown that Rb pathway inhibition causes overexpression of the mitotic checkpoint gene Mad2, but whether Mad2 overexpression is required to generate CIN in this context is unknown. Here, we show that CIN in cultured cells lacking Rb family proteins requires Mad2 upregulation and that this upregulation is also necessary for CIN and tumor progression in vivo. Mad2 is also repressed by p53 and its upregulation is required for CIN in a p53 mutant tumor model. These results demonstrate that Mad2 overexpression is a critical mediator of the CIN observed upon inactivation of two major tumor suppressor pathways.


Figures

Figure 1
Figure 1. P53 Represses Mad2 Expression by Induction of P21
(A) Western blot of primary mouse embryonic fibroblasts (MEFs) derived from wild-type, p53+/− or p53−/− embryos. H2AX serves as loading control for phospho-histone H3 (Ser10; pHH3). (B) Reporter assays showing repressive activity of wild-type and mutant p53 on the Mad2 promoter. HCT116 cells were co-transfected with a firefly luciferase vector in which luciferase expression is controlled by 235 bp of the human Mad2 promoter and an expression vector containing either wild-type p53 or the DNA-binding deficient mutant p53V143A (see also (E)). Renilla luciferase and GFP expressing vectors were co-transfected for normalization of transfection efficiency (top) and exogenous p53 protein expression (Western blots below). Triangles indicate increasing amounts of transfected p53. Means ± SD are shown for assays performed in triplicate. (C) Western blot of MEFs derived from wild-type, p21+/− or p21−/− embryos. H2AX serves as loading control for phospho-histone H3 (pHH3). (D) Reporter assays as in (B) using a p21 expression vector. Means ± SD are shown. (E) Genomic structure of the Mad2 gene and the luciferase reporter construct containing 235 base pairs of the Mad2 promoter. E2F, putative E2F binding site; CHR, cell cycle homology region; CDE, cell cycle-dependent element (see also text for details). (F) Reporter assays as in (B) using HCT116-p21+/+ or HCT116-p21−/− cells and expression vectors containing no insert (Vect.), wild-type p53 (WT), DNA-binding deficient p53V143A (VA) or the p53R175P mutant (RP), which can induce p21 expression but not apoptosis (Liu et al., 2004 and Western blots below). Means ± SD are shown. See also Figure S1.
Figure 2
Figure 2. P53 Represses Mad2 Expression through Crosstalk to the Rb Pathway
(A) Top: Western blot of Rb triple knockout (p107−/−, p130−/−, pRb−/−; TKO) and wild-type (WT) MEFs overexpressing p21 (Dox (hrs) indicates time after induction). Bottom: Quantification of Western blots shown in upper panels. Relative levels of Mad2 and p21 proteins are each normalized to actin on the same blot. See also Figure S2A. (B) Reporter assays as in Figure 1B using HCT116-p21−/− cells and mutant p21 expression vectors. Wild-type p21 (green) and p21 containing mutations in the cyclin binding domains Cy1 and/or Cy2 (mCy1, mCy2) and/or the kinase binding domain K (mK) (red) were assayed for their ability to repress Mad2 promoter activity. Means ± SD are shown. Numbers above each bar indicate the fold decrease in Cdk binding activity (green, red) as a result of the respective mutation(s), as determined by Chen et al., 1996. Western blots below show relative expression of exogenous wild-type and mutant p21 with respect to GFP. (C) Electrophoretic mobility shift assay (EMSA) of CHR-CDE/E2F elements in the Mad2 promoter. Top: Wild-type or mutant CHR (mCHR) labeled probes encompassing the CHR-CDE/E2F elements in the Mad2 promoter were incubated with HeLa nuclear extract (extract) and antibodies specific for E2F-4 or E2F-5 (α-E2F4, α-E2F5), as indicated. Bottom: fold change in ratio of the intensities of band A/B. See also Figure S2.
Figure 3
Figure 3. Normalization of Mad2 levels in TKO MEFs
(A) Western blot showing Mad2 levels in wild-type (WT), Mad2 heterozygote (Mad2+/−), and Rb, p107 and p130 triple (TKO), single and double p107 and p130 knockout MEFs. Actin and a larger molecular weight non-specific band serve as a loading control. (B) Western blot and quantification of Mad2 levels in wild-type (WT1 and WT2) and TKO MEFs transduced with lentiviral vectors expressing sh-scrambled control (Ctrl), sh-Mad2#1, sh-Mad2#2 and sh-Mad2#3. Levels are normalized to Actin. (C) 3T3 proliferation assay for TKO MEFs transduced with corresponding short hairpin lentiviral vectors. Averages ± SD of two independent experiments are shown. (D) Colony formation assay and quantification of colonies for TKO Control, shMad2#1, shMad2#2 and shMad2#3 vectors. Averages ± SEM of two independent experiments are shown (p < 0.002 for shMad2#3, all others p > 0.4; unpaired t-test). See also Figure S3.
Figure 4
Figure 4. Mad2 Upregulation is Required for Rb Loss-Induced CIN and Accelerates Transformation of TKO MEFs
(A) Chromosome counts for sh-scrambled control and shMad2#1 TKO MEFs. Error bars indicate SD. p value as determined by non-parametric Mann-Whitney test. (B) CIN Assay. Each column corresponds to one chromosome analyzed in one colony by FISH. Scrambled shCtrl colonies in teal, shMad2#1 in orange and shMad2#2 in red. Percentages indicate mode. Non-modal groups that comprise deviation from the mode are in dark blue. p value for control versus individual shMad2 and combined shMad2 assays < 0.005 as determined by Mann-Whitney non-parametric test. (C) Anchorage Independent Growth Assay. Averages ± SEM of two independent experiments are shown (p < 0.0037; unpaired t-test). (D) Contact Inhibition Assay. Confluent plates were transfected with an HrasV12 vector and colonies stained after 3 weeks. (E) Intradermal Allograft Growth. Each point is the average size of 6 tumors. Averages ± SEM of two independent experiments are shown. All p values between scrambled sh control and shMad2 curves < 0.05 (unpaired t-test). See also Figure S4 and Table S1.
Figure 5
Figure 5. Mad2 Upregulation Is Required for the Development of Anaplastic Mammary Tumors in WAPT121 Transgenic Mice
(A) Western blot of adult pretumorigenic mammary glands from female Mad2+/+ and Mad2+/ transgenic (WAPT121) and non-transgenic mice. Lanes 3 and 4 are lysates from 2 different animals. (B) Tumor-free survival of Mad2+/+ and Mad2+/− in WAPT121 mice. p value determined from Gehan-Breslow-Wilcoxon Test. Vertical lines indicate censored subjects. (C) Tumor burden (# of tumors per animal) as determined by macroscopic analysis in Mad2+/+ and Mad2+/− in WAPT121 mice. Averages ± SEM are shown. (D) Mammary tumor type distribution in Mad2+/+ (N=65) and Mad2+/− (N=68) WAPT121 mice. p value (Fisher’s test) for Adenosquamous/Anaplastic = 0.0003; Adenocarcinoma/Anaplastic = 0.0086. (E) Representative H&E examples of tumor types in Mad2+/+ and Mad2+/− WAPT121 mice. The two anaplastic tumors shown are examples from two different animals.
Figure 6
Figure 6. Anaplastic Mammary Tumors in WAPT121;Mad2+/+ Mice Are Aneuploid, Invasive and More Metastatic
(A) Percent of aneuploid cells as determined by chromosome FISH in Mad2+/+ and Mad2+/− WAPT121 animals distributed by tumor type. p values calculated using unpaired t-test. (B) Representative examples of chFISH in adenosquamous WAPT121;Mad2+/− and anaplastic WAPT121;Mad2+/+ tumors. Scale bar indicates 10 μm. (C) Representative example of epithelial to mesenchymal transition (EMT) as determined by loss of E-cadherin and gain of Vimentin immunofluorescence staining in an anaplastic tumor. Normal appearance (E-cadherin positive and Vimentin negative) of an adenocarcinoma is seen in lower panels. (D) Representative examples of H&E and CyclinD1, Keratin8 and Ki67 immunohistochemistry examples from adenosquamous WAPT121;Mad2+/− and anaplastic WAPT121;Mad2+/+ tumors. (E) Frequency of spontaneous metastasis by tumor subtype in WAPT121;Mad2+/+ mice. p value for adenocarcinomas and anaplastic tumors = 0.0342 (unpaired t-test). Error bars indicate SEM. (F) Representative H&E examples of metastatic lesions in WAPT121;Mad2+/+ animals harboring anaplastic tumors. See also Figure S5.
Figure 7
Figure 7. Normalization of Elevated Mad2 Levels Rescues CIN in a p53 Mutant Mouse Model
(A) Reporter assays as in Figure 1B comparing p53R175P repressive activity to wild-type p53 and p21. Means ± SD are shown. Western blots below show relative levels of exogenous p53 and p21 and relative induction of endogenous p21 expression. (B) Western blot analysis and quantification of wild-type, p53C/C, p53C/C p21−/− and p53C/C p21−/− Mad2+/− MEF lysates. (C) Lymphoma incidence in p53C/C, p53C/C p21−/− and p53C/C p21−/− Mad2+/− animals. p values calculated using one-sided Fisher’s exact tests. Right, representative H&E from splenic lymphomas from mice with indicated genotypes. (D) Percent of aneuploid cells in tumors from p53C/C, p53C/C p21−/− and p53C/C p21−/− Mad2+/− mice as determined by chromosome FISH. p values calculated using one-sided Fisher’s exact tests. (E) Model of Mad2 expression regulation showing crosstalk between p53 and Rb pathways via p21 action on the Mad2 promoter. An unknown protein(s) (X) stabilizes the interaction of the repressor E2F (red)/p107 or p130 (p107/p130) complex through the CHR element. Activator E2Fs (blue) serve as transcriptional activators at the upstream E2F binding site. See also Figure S6.

Comment in

References

    1. Baker DJ, Jin F, Jeganathan KB, van Deursen JM. Whole chromosome instability caused by Bub1 insufficiency drives tumorigenesis through tumor suppressor gene loss of heterozygosity. Cancer Cell. 2009;16:475–486. - PMC - PubMed
    1. Barboza JA, Liu G, Ju Z, El-Naggar AK, Lozano G. p21 delays tumor onset by preservation of chromosomal stability. Proc Natl Acad Sci U S A. 2006;103:19842–19847. - PMC - PubMed
    1. Burds AA, Lutum AS, Sorger PK. Generating chromosome instability through the simultaneous deletion of Mad2 and p53. Proc Natl Acad Sci U S A. 2005;102:11296–11301. - PMC - PubMed
    1. Chen J, Saha P, Kornbluth S, Dynlacht BD, Dutta A. Cyclin-binding motifs are essential for the function of p21CIP1. Mol Cell Biol. 1996;16:4673–4682. - PMC - PubMed
    1. Coschi CH, Martens AL, Ritchie K, Francis SM, Chakrabarti S, Berube NG, Dick FA. Mitotic chromosome condensation mediated by the retinoblastoma protein is tumor-suppressive. Genes Dev. 2010;24:1351–1363. - PMC - PubMed

Publication types

MeSH terms