. 2011 Jun 14;19(6):715-27.
doi: 10.1016/j.ccr.2011.04.016.

Receptor tyrosine kinases and TLR/IL1Rs unexpectedly activate myeloid cell PI3kγ, a single convergent point promoting tumor inflammation and progression

Affiliations

Receptor tyrosine kinases and TLR/IL1Rs unexpectedly activate myeloid cell PI3kγ, a single convergent point promoting tumor inflammation and progression

Michael C Schmid et al. Cancer Cell. .

Abstract

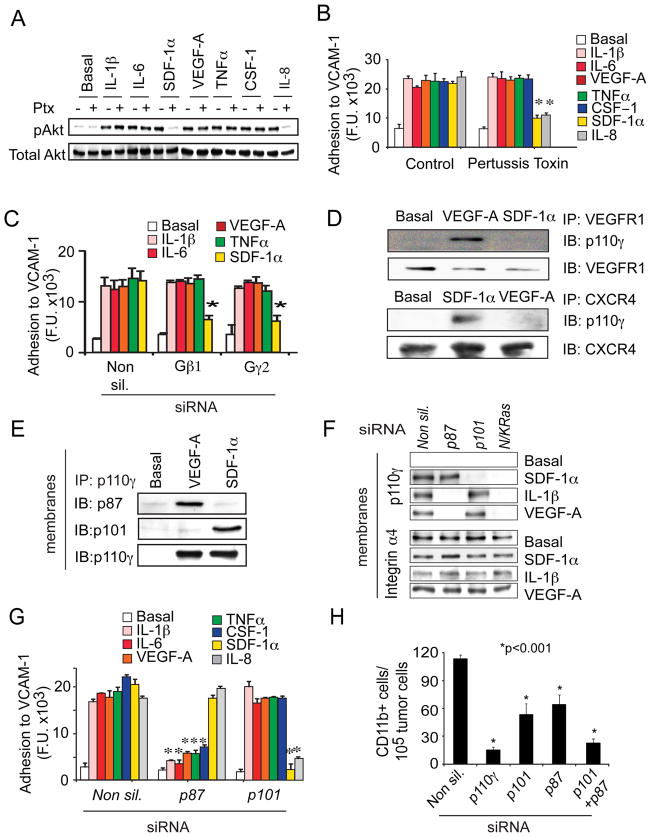
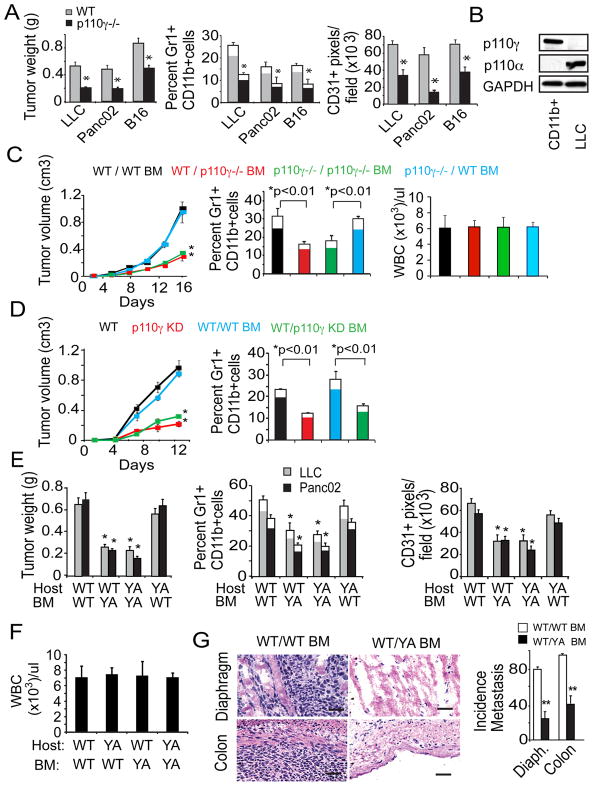
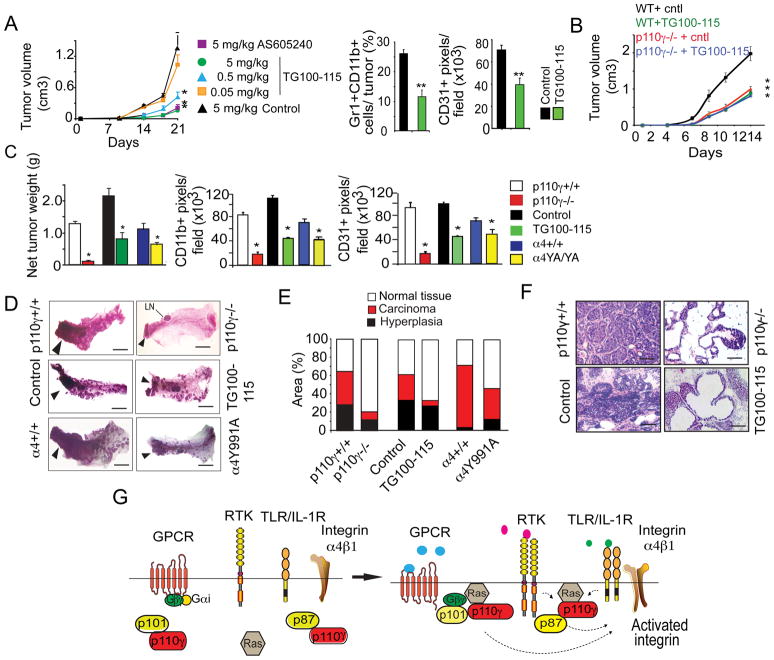
Tumor inflammation promotes angiogenesis, immunosuppression, and tumor growth, but the mechanisms controlling inflammatory cell recruitment to tumors are not well understood. We found that a range of chemoattractants activating G protein-coupled receptors (GPCRs), receptor tyrosine kinases (RTKs) and Toll-like/IL-1 receptors (TLR/IL1Rs) unexpectedly initiate tumor inflammation by activating the PI3-kinase isoform p110γ in Gr1+CD11b+ myeloid cells. Whereas GPCRs activate p110γ in a Ras/p101-dependent manner, RTKs and TLR/IL1Rs directly activate p110γ in a Ras/p87-dependent manner. Once activated, p110γ promotes inside-out activation of a single integrin, α4β1, causing myeloid cell invasion into tumors. Pharmacological or genetic blockade of p110γ suppressed inflammation, growth, and metastasis of implanted and spontaneous tumors, revealing an important therapeutic target in oncology.


Figures

Figure 1
Figure 1. Diverse tumor-derived chemoattractants promote myeloid cell trafficking to tumors
(A) Left, CD11b+ pixels/field in normal human and murine breast and invasive ductal breast carcinoma, normal mouse pancreas and orthotopic Panc02 pancreatic carcinoma, and normal murine lung and orthotopic LLC (n=6–10), *p<0.001 vs normal tissue. Right, CD11b+ cells (red, arrowheads) and nuclei (blue) in normal murine and human breast and invasive ductal carcinoma; scale bars, 40 μm. (B) Graphs, quantification of myeloid (CD11b) and endothelial (CD31) cells over time in LLC tumors, *p<0.05 (n=10). Images, LLC tumor sections immunostained to detect myeloid (CD11b) and endothelial (CD31) cells; scale bars, 40 μm. (C) Flow cytometric quantification of Gr1+CD11b myeloid cells in tumors (n=3). Tumor-derived myeloid cells are comprised primarily of Gr1lo/negCD11b+F4/80+CD14+MHCII+ monocyte/macrophages. (E) Relative levels of chemoattractant gene expression in CD11b+ myeloid cells and CD11b- tumor cells from 14d orthotopic LLC tumors (n=4), *p<0.05 vs normal lung. (F) SDF-1α and IL-1β protein expression in tumor-derived CD11b+ myeloid and tumor cells from 14d LLC tumors (n=3), *p<0.05. See also Figure S1.
Figure 2
Figure 2. Diverse tumor-derived chemoattractants promote integrin α4β1
dependent myeloid cell trafficking (A) Adhesion of stimulated myeloid cells to EC in the presence of medium (untreated), control IgG (cIgG), anti-α4 or anti-αM integrin antibody, or small molecule inhibitor of integrin α4 (ELN476063) (n=3), *p<0.001 vs IgG. (B) Adhesion to EC of stimulated WT, α4Y991A, α4-/−, αM-/− and integrin α4 (Itga4) or αM (Itgam) siRNA transfected myeloid cells (n=3), *p<0.001 vs WT. (C) Left: HUTS21 antibody (activated integrin β1) binding to unstimulated, SDF-1α, IL1β, or Mn2+ stimulated human CD11b+ cells. Right: Mean fluorescence intensity per stimulus (MFI). (D) MFI of VCAM-1/Fc binding to stimulated WT or α4Y991A myeloid cells (n=3), *p<0.01 vs WT. (E) Trafficking to LLC tumors of WT, α4Y991A, integrin α4-/−, integrin αM-/− or α4 (itga4), αM (itgam) or non-silencing siRNA transfected myeloid cells (n=3–6), *p<0.001 vs WT cells. See also Figure S2.
Figure 3
Figure 3. p110γ PI3K activity is necessary and sufficient to promote myeloid cell trafficking to tumors
Adhesion to VCAM-1 of chemoattractant-treated murine myeloid cells from (A) WT, p110γ−/− and p110γKD/KD mice (n=3), *p< 0.001 vs WT or (B) WT myeloid cells transfected with non-silencing, Pi3kα, β, γ, or δ siRNAs (n=3–6), *p< 0.001 vs non-silencing siRNA. (C) Adhesion to VCAM-1 of stimulated murine myeloid cells treated with TG100-115 and AS605240 (p110γ inhibitors), TGX221 (p110β inhibitor) or PI3Kα2 (p110α inhibitor). IC50TG100-115: IL-1β = 281 nM, SDF-1α = 158 nM; IC50AS605240: IL-β = 50 nM, SDF-1α = 50 nM. IC50 TGX221 and PI3Kα2 > 1 mM (n=3) *p<0.001 vs WT. (D) Adhesion to VCAM-1 of stimulated murine and human myeloid cells treated with TG100-115, AS605240, TGX221, or PI3Kα2. (E) VCAM-1/Fc binding to SDF-1α or IL-1β stimulated CD11b+ myeloid cells from WT or p110γ−/− mice or cells treated with 1 μM TG100-115, AS605240, PI3Kα2, TGX221 or control (n=3) *p<0.01 vs control. (F) Adhesion to VCAM-1 of unstimulated myeloid cells from WT and p110γCAAX mice (n=3), *p<0.01 vs WT. (G) Number/105 LLC tumor cells of adoptively transferred, fluorescently labeled myeloid cells transfected with non-silencing, Pi3k p110α, β, γ, or δ siRNAs, myeloid cells pretreated with TG100-115, PI3Kα2, or TGX221, and myeloid cells isolated from p110γ−/− mice (n=3), *p<0.001 vs non sil. siRNA. See also Figure S3.
Figure 4
Figure 4. RTKs and TLR/IL-1Rs promote PI3-kinase p110γ catalytic activity
(A) Western blotting of p110 isoforms in murine CD11b+ myeloid cells, lymphocytes and LLC tumor cells. (B) Quantification of protein and mRNA expression of p110 isoforms in murine CD11b+ myeloid cells. (C) Lysates of stimulated WT and p110γ−/− CD11b+ myeloid cells immunoblotted to detect pThr 308Akt and total Akt. (D) Upper graphs: time courses of p110γ activation in WT and p110γ−/− myeloid cells transiently expressing the PI(3,4,5)P3 reporter AKT-PH-EGFP. Primary myeloid cells were imaged live before and after treatment with 200ng/ml IL-1β, SDF-1α, or VEGF-A. Results are expressed as the mean ratio of AKT-PH-EGFP plasma membrane to cytosolic fluorescence +/− s.e.m, averaged over multiple experiments. t=0 corresponds to the time of growth factor addition. Lower graphs: time courses of IL-1β, SDF-1α, or VEGF-A stimulated myeloid cell fluorescence with and without addition of the p110γ selective inhibitor AS605240. t=0 corresponds to time of inhibitor addition. (E) Representative wild type or p110γ−/− primary myeloid cells transiently expressing the PI(3,4,5)P3 reporter AKT-PH-EGFP imaged live before and after treatment with AS605240, IL-1β, SDF-1α, or VEGF-A, scale bars, 5 μm. See also Figure S4.
Figure 5
Figure 5. RTKs and TLR/IL-1Rs activate p110γ directly via p87
(A) Immunoblots of pThr308Akt and total Akt in chemoattractant-stimulated myeloid cells treated with or without 100ng/ml Ptx. (B-C) Adhesion to VCAM-1 of chemoattractant-stimulated myeloid cells treated (B) with or without 100ng/ml Ptx or (C) transfected with non-silencing (Non sil.), Gβ1 or Gγ2 siRNA (n=3), *p<0.001 vs control (B) or vs Non silencing (C). (D) p110γ co-immunoprecipitation with VEGFR1 (upper) or CXCR4 (lower) in unstimulated (basal), VEGF-A or SDF-1α stimulated primary myeloid cells. (E) Co-immunoprecipitation of p87 or p101 with p110γ from membrane fractions of unstimulated (basal), VEGF-A or SDF-1α stimulated primary myeloid cells. (F) Immunoblots of p110γ and integrin α4 in membrane fractions from unstimulated (basal), SDF-1α, VEGF-A, and IL-1β stimulated myeloid cells transfected with non-silencing, p87, p101 and N/K Ras siRNAs. (G) Adhesion to VCAM-1 of non-silencing (Non sil.), p87, p101 and Ras siRNA transfected myeloid cells (n=3), *p<0.001 vs Non silencing siRNA. (H) Trafficking to tumors of myeloid cells transfected with non-silencing, p110γ, p101 or p87 siRNA (n=3). *p<0.001 vs Non-silencing siRNA. See also Figure S5.
Figure 6
Figure 6. Ras is necessary and sufficient to activate myeloid cell p110γ
(A) Immunoblots of active (GTP-Ras) and total Ras in chemoattractant-stimulated myeloid cells with or without 100 ng/ml Ptx. (B) Adhesion to VCAM-1 of control (Non sil.), N/K Ras-, Raf-, and MEK-siRNA transfected myeloid cells (n=3), *p<0.01 vs control. (C) Adhesion to VCAM-1 of control-, RasV12-, RasV12C40-, and RasV12S35-transfected myeloid cells (n=3), *p<0.01 vs vector control. (D) Adhesion to VCAM-1 of RasV12 transfected cells treated with TG100-115; p110γ−/− myeloid cells transfected with RasV12, and WT myeloid cells transfected with RasV12 in combination with non-silencing, p110α, p110β, p110γ, p110δ, and itga4 siRNA. (n=3), *p<0.01 vs RasV12. (E) VCAM-1/Fc binding (MFI) to WT or p110γ−/− myeloid cells transfected with RasV12 in combination with non-silencing, p110α, β, γ, or δ siRNAs (n=3), *p<0.01 vs WT. (F) Trafficking to tumors of control or FTI treated myeloid cells and control transfected (Non-Sil.) or N+K ras siRNA transfected myeloid cells (n=3), *p<0.01 vs Ctrl. See also Figure S6.
Figure 7
Figure 7. p110γ and integrin α4β1 are required for tumor inflammation, growth and progression
(A) Tumor weight, percent Gr1+CD11b+ cells (filled, Gr1lo; white, Gr1hi) in tumors, and CD31+ pixels/field in LLC, Panc02, and B16 tumors in WT and p110γ−/− mice (n=8–10), *p<0.01 vs WT. (B) Immunoblot analyses of p110α and p110γ in tumor-derived CD11b+ and LLC cells. (C) LLC tumor volume, percent Gr1+CD11b+ cells (filled, Gr1lo; white, Gr1hi) in tumors, and circulating WBCs/μl in WT mice with WT (black) or p110γ−/− bone marrow (BM, red), and in p110γ−/− mice with WT (blue) or p110γ−/− BM (green) bone marrow; *p<0.01 vs WT/WT. (D) Tumor volume and percent Gr1+CD11b+ cells in LLC tumors grown in WT (black line) and p110γKD (red line) animals and in WT animals with WT BM (blue) or p110γKD BM (green), (n=9–10 per group) *p<0.01 vs WT. (E) LLC or Panc02 tumor weight, percent Gr1+CD11b+ cells in tumor, and CD31+ pixels/field in WT or α4Y991A (YA) animals transplanted with WT or YA BM (n=8) *p<0.05 vs WT mice with WT BM. (F) Circulating WBCs/μl in WT mice with WT or α4Y991A BM. (G) Images, H&E-stained diaphragm and colon from BM transplanted, Panc02 implanted animals from E, scale bars, 40 μm. Graphs, incidence of colon and diaphragm metastases (n=8), *p<0.05 vs WT/WT. See also Figure S7 and Table S1.
Figure 8
Figure 8. p110γ inhibition blocks spontaneous breast tumor growth and progression
(A) Mice with LLC tumors were treated with control, AS605240, or TG100-115 (n=10). Left, tumor volume, *p<0.01 vs control. Middle, percent Gr1+CD11b+ cells, **p<0.001 vs control. Right, CD31+ pixels/field in control (black) and 0.5 mg/kg/day TG100-115 treated (green) tumors, **p<0.001 vs control. (B) Tumor volume in WT (black) and p110γ−/− (red) mice with LLC tumors treated with control, and WT mice (green) and p110γ−/− mice (blue) treated with TG100-115 at 5 mg/kg/day. (C) Tumor burden, CD11b+ myeloid cells and CD31+ blood vessels in spontaneous breast tumors from 9 week old control and TG100-115 treated, p110γ+/+ and p110γ−/−, and WT and α4Y991A FVB PyMT+ mice (n=10), *p<0.01 vs control. (D) Whole mounts of 4th mammary glands from B. Arrowheads, adenocarcinoma. LN, lymph node, scale bars, 400μm. (E) Percent area of normal, hyperplastic and carcinoma tissue from C (n=10), p<0.001 carcinoma vs WT, p<0.01 normal tissue vs WT and p= 0.45 hyperplasia vs WT. (F) H&E-stained mammary glands from C, scale bars, 40 μm. (G) Role of p110γ during tumor inflammation: cytokines and growth factors activate primary myeloid cell p110γ in a p87-Ras-dependent manner, and chemokines activate p110γ in a Gβγ-p101-Ras-dependent manner. Both pathways promote integrin α4β1 activation, with subsequent stimulation of myeloid cell trafficking, tumor growth and progression. See also Figure S8 and Table S2.

Comment in

References

    1. Arnaout MA, Mahalingam B, Xiong JP. Integrin structure, allostery, and bidirectional signaling. Annu Rev Cell Dev Biol. 2005;21:381–410. - PubMed
    1. Bergmeier W, Goerge T, Wang HW, Crittenden JR, Baldwin AC, Cifuni SM, Housman DE, Graybiel AM, Wagner DD. Mice lacking the signaling molecule CalDAG-GEFI represent a model for leukocyte adhesion deficiency type III. J Clin Invest. 2007;117:1699–1707. - PMC - PubMed
    1. Biswas SK, Mantovani A. Macrophage plasticity and interaction with lymphocyte subsets: cancer as a paradigm. Nat Immunol. 2010;11:889–896. - PubMed
    1. Bronte V, Apolloni E, Cabrelle A, Ronca R, Serafini P, Zamboni P, Restifo NP, Zanovello P. Identification of a CD11b(+)/Gr-1(+)/CD31(+) myeloid progenitor capable of activating or suppressing CD8(+) T cells. Blood. 2000;96:3838–3846. - PMC - PubMed
    1. Bunt SK, Sinha P, Clements VK, Leips J, Ostrand-Rosenberg S. Inflammation induces myeloid-derived suppressor cells that facilitate tumor progression. J Immunol. 2006;176:284–290. - PubMed

Publication types