

Signaling clusters in the cell membrane
- PMID: 21665455
- PMCID: PMC3703921
- DOI: 10.1016/j.ceb.2011.05.003
Signaling clusters in the cell membrane
Abstract
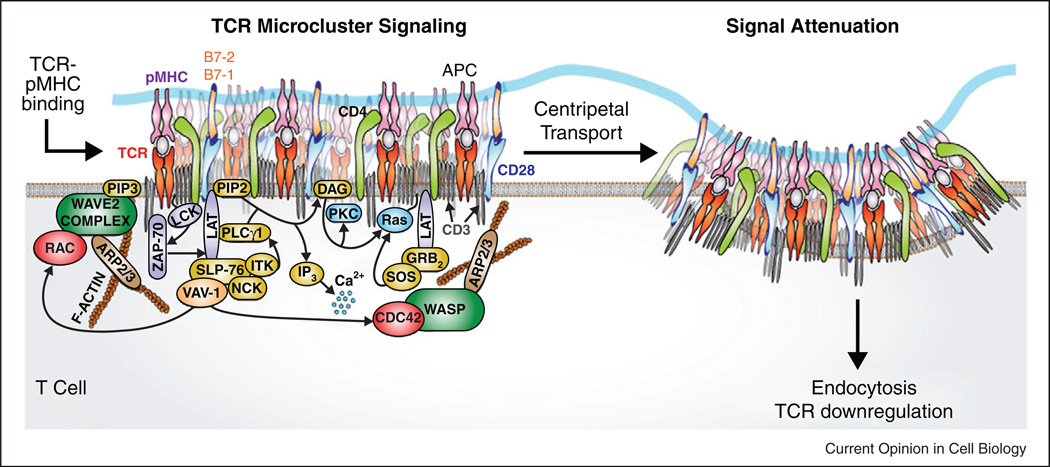
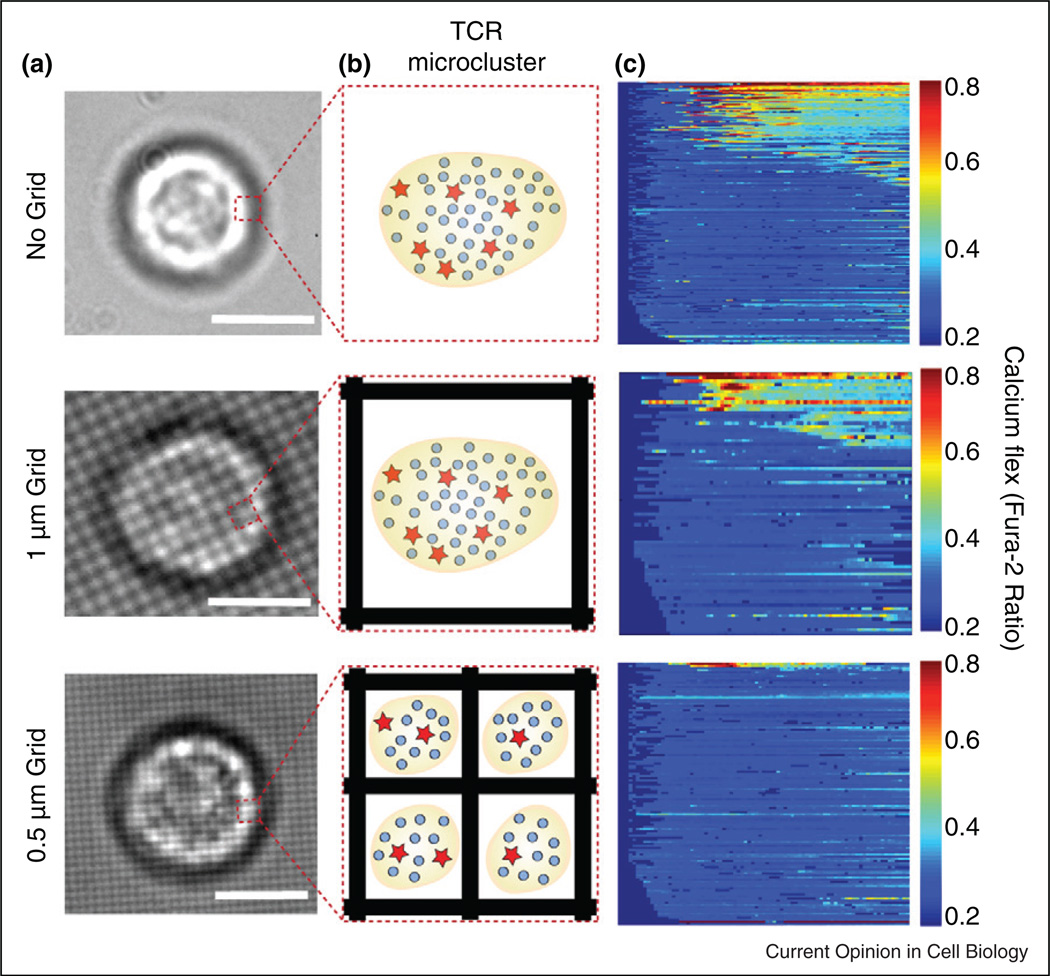
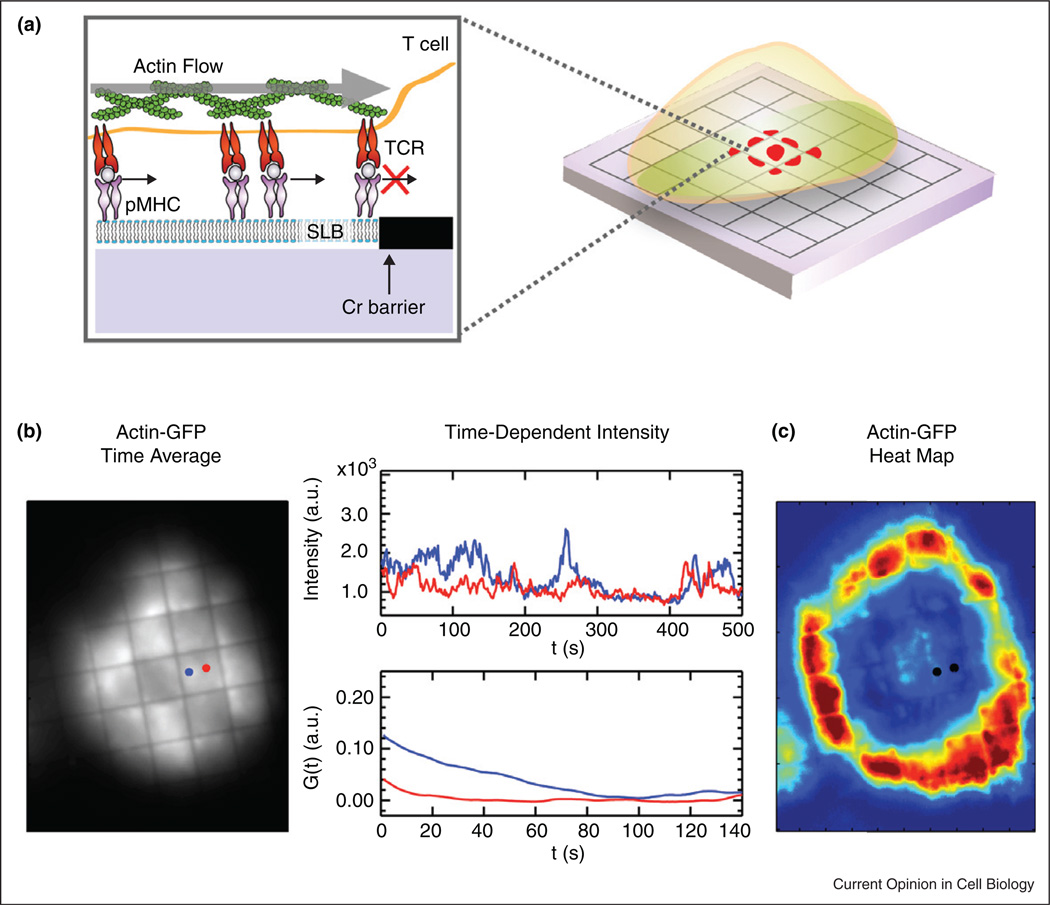
Large-scale molecular assemblies, or signaling clusters, at the cell membrane are emerging as important regulators of cell signaling. Here, we review new findings and describe shared characteristics common to signaling clusters from a diverse set of cellular systems. The well-known T cell receptor cluster serves as our paradigmatic model. Specifically, each cluster initiates recruitment of hundreds of molecules to the membrane, interacts with the actin cytoskeleton, and contains a significant fraction of the entire signaling process. Probed by recent advancements in patterning and microscopy techniques, the signaling clusters display functional outcomes that are not readily predictable from the individual components.
Copyright © 2011 Elsevier Ltd. All rights reserved.
Figures
References
-
-
Choudhuri K, Dustin ML. Signaling microdomains in T cells. FEBS Lett. 2010;584:4823–4831.. This is a comprehensive review on recent discoveries in T cell signaling.
-
-
- Saito T, Yokosuka T. Immunological synapse and microclusters: the site for recognition and activation of T cells. Curr Opin Immunol. 2006;18:305–313. - PubMed
-
- Seminario MC, Bunnell SC. Signal initiation in T-cell receptor microclusters. Immunol Rev. 2008;221:90–106. - PubMed
-
- Huse M. The T-cell-receptor signaling network. J Cell Sci. 2009;122:1269–1273. - PubMed
-
- Maddock JR, Shapiro L. Polar location of the chemoreceptor complex in the Escherichia coli cell. Science. 1993;259:1717–1723. - PubMed
Publication types
MeSH terms
Substances
Grants and funding
LinkOut - more resources
Full Text Sources
Other Literature Sources
