. 2011 Aug 12;286(32):27927-35.
doi: 10.1074/jbc.M111.255810. Epub 2011 Jun 10.

Mitotic modulation of translation elongation factor 1 leads to hindered tRNA delivery to ribosomes

Affiliations

Mitotic modulation of translation elongation factor 1 leads to hindered tRNA delivery to ribosomes

Gilad Sivan et al. J Biol Chem. .

Abstract

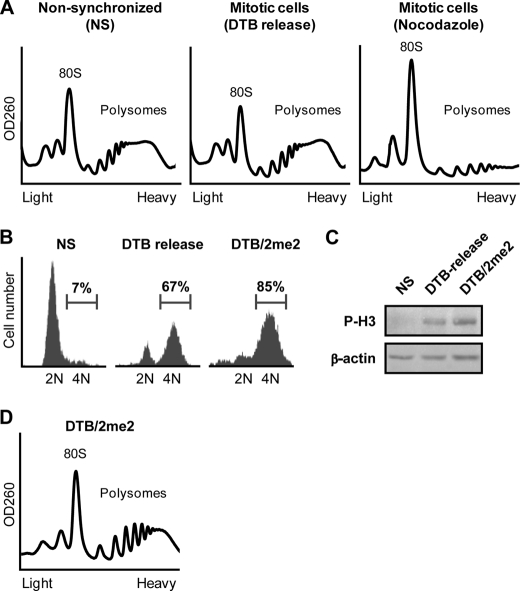
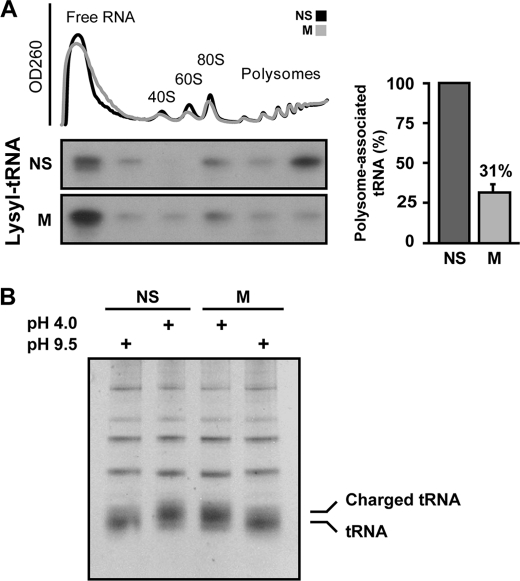
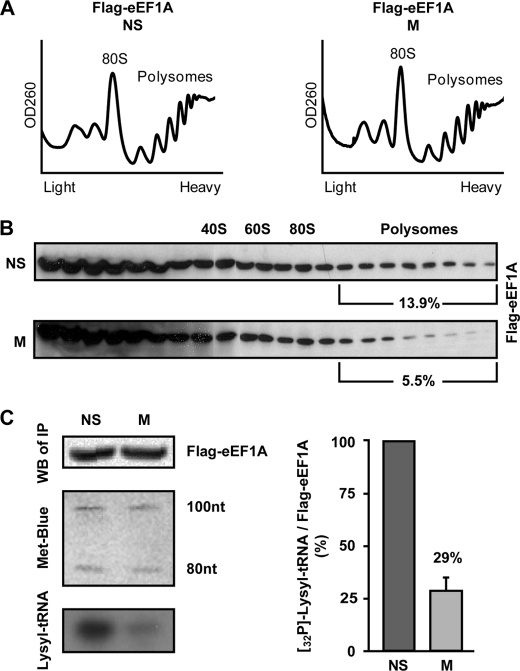
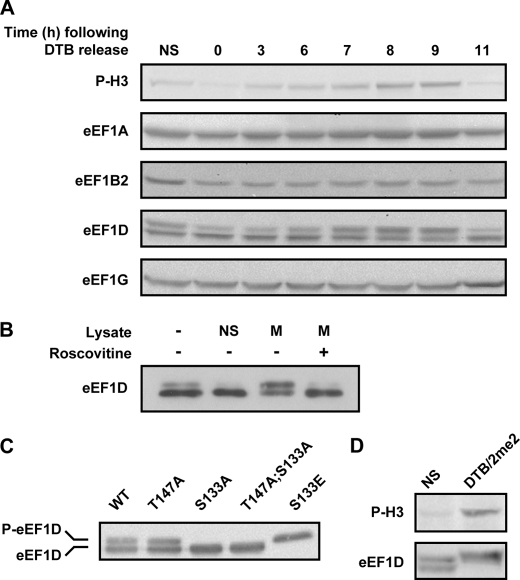
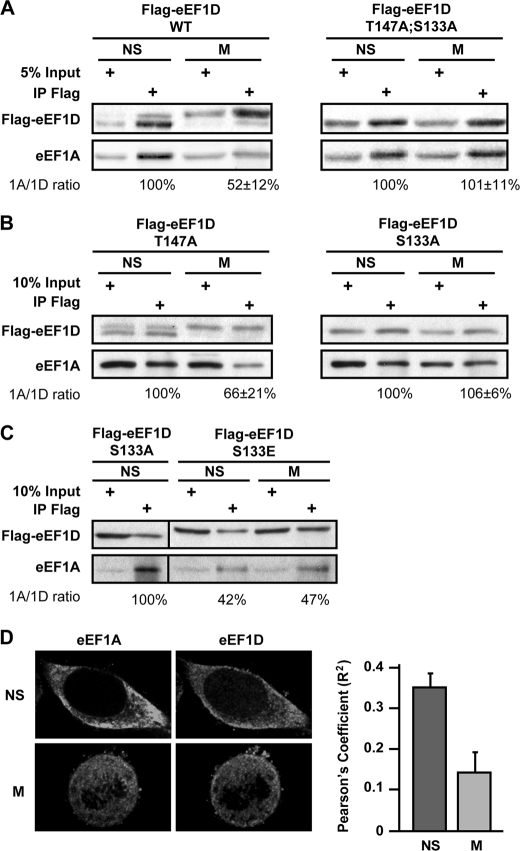
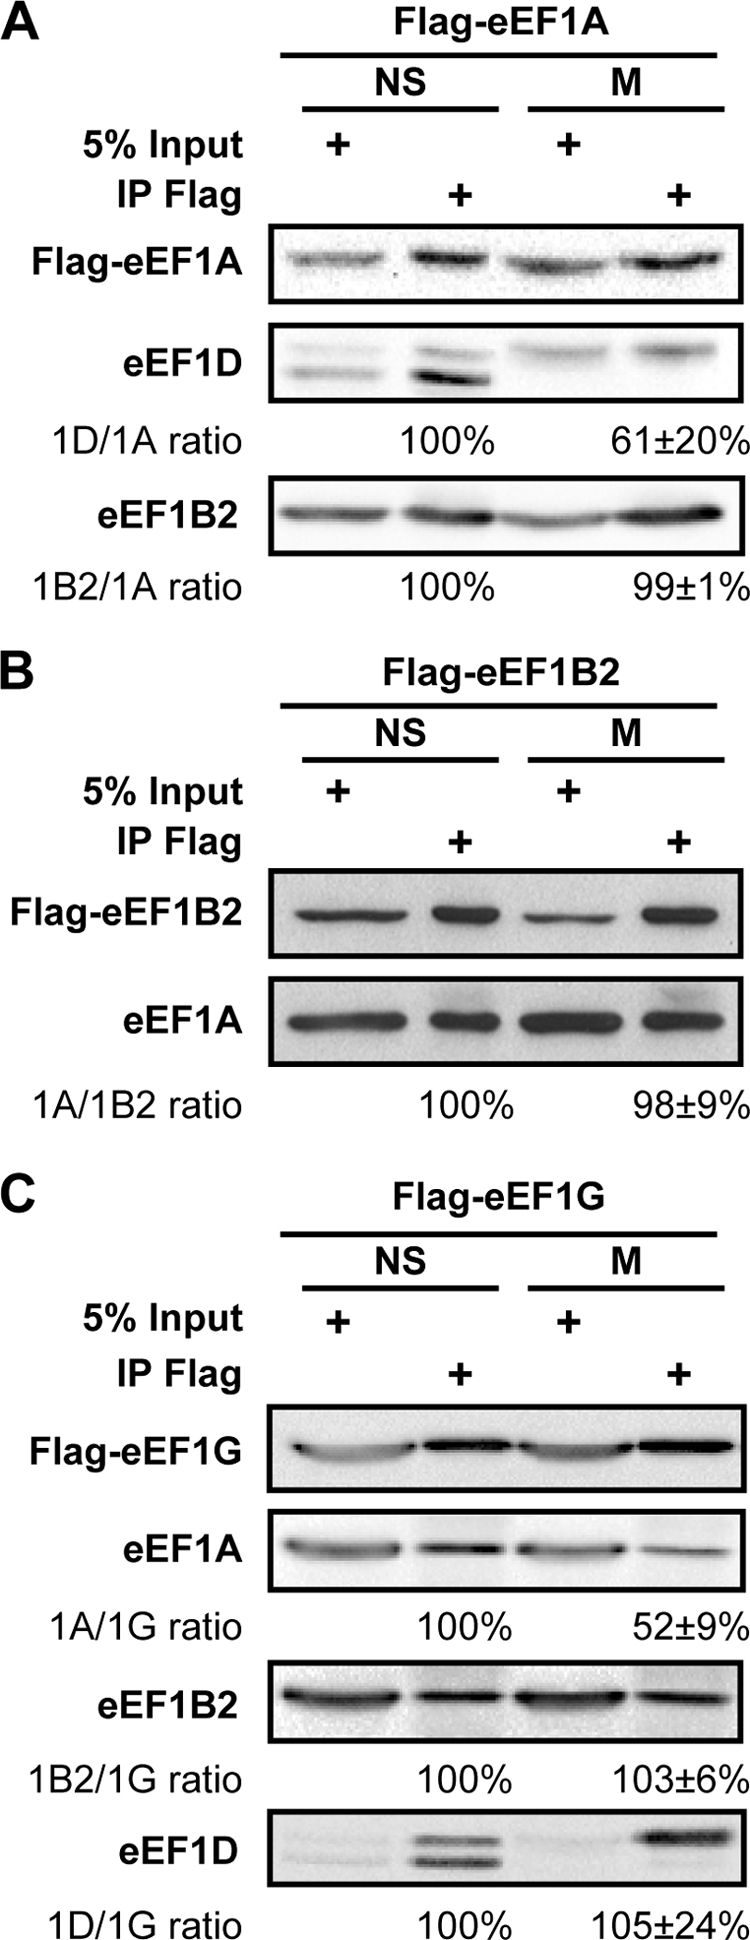
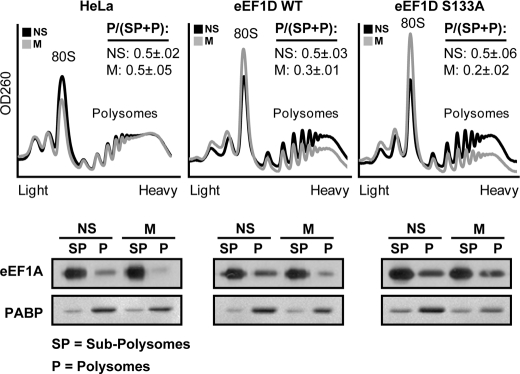
Translation elongation in eukaryotes is mediated by the concerted actions of elongation factor 1A (eEF1A), which delivers aminoacylated tRNA to the ribosome; elongation factor 1B (eEF1B) complex, which catalyzes the exchange of GDP to GTP on eEF1A; and eEF2, which facilitates ribosomal translocation. Here we present evidence in support of a novel mode of translation regulation by hindered tRNA delivery during mitosis. A conserved consensus phosphorylation site for the mitotic cyclin-dependent kinase 1 on the catalytic delta subunit of eEF1B (termed eEF1D) is required for its posttranslational modification during mitosis, resulting in lower affinity to its substrate eEF1A. This modification is correlated with reduced availability of eEF1A·tRNA complexes, as well as reduced delivery of tRNA to and association of eEF1A with elongating ribosomes. This mode of regulation by hindered tRNA delivery, although first discovered in mitosis, may represent a more globally applicable mechanism employed under other physiological conditions that involve down-regulation of protein synthesis at the elongation level.


Figures

FIGURE 1.
FIGURE 1.
Polysomes remain stable during mitosis. A, HeLa cells, either non-synchronized or synchronized to mitosis using nocodazole or release from double thymidine block (DTB release), as indicated, were analyzed for their polysomal profile. 80 S and polysomes are indicated. B, HeLa cells, either non-synchronized or synchronized to mitosis by release from DTB or by release from DTB followed by treatment with 2me2 (DTB/2me2), as described under “Experimental Procedures,” were stained for DNA content with propidium iodide followed by flow cytometry analysis and subjected to immunoblot analysis (C) using antibodies specific to the mitotic marker phospho-histone H3 (P-H3) and β-actin. D, mitotic (DTB/2me2) HeLa cells were analyzed for polysomal profile. 80 S and polysomes are indicated.
FIGURE 2.
FIGURE 2.
Less tRNA is associated with mitotic polysomes. A, non-synchronized (NS) and mitotic (M) HeLa cells were analyzed for their polysomal profile. Free RNA, ribosomal subunits, and polysomes are indicated. RNA was extracted from six consecutive pooled fractions along the gradient and resolved on an 8 m urea-12% polyacrylamide gel followed by staining with methylene blue to verify equal loading. The RNA was then analyzed by Northern blot hybridization with 32P-labeled DNA oligonucleotide corresponding to lysyl tRNA. Shown is one representative of three independent experiments. The intensity of the lysyl tRNA signal in polysomes relative to total tRNA was quantified by densitometry. The bar graph shows the mean ± S.E. of polysome-associated tRNA in mitotic relative to non-synchronized cells. B, tRNA aminoacylation is not reduced during mitosis. RNA was extracted from NS and M HeLa cells under acidic conditions (pH 4.0), and tRNA was deacylated by base treatment (pH 9.5) for 30 min at 37 °C. Treated and untreated samples were then resolved on an acidic 8 m urea-15% polyacrylamide gel (pH 5.0) and stained with ethidium bromide. Aminoacylated tRNAs (charged tRNA) and non-aminoacylated tRNAs are indicated.
FIGURE 3.
FIGURE 3.
eEF1A is depleted from polysomes and binds less tRNA during mitosis. A, non-synchronized (NS) and mitotic (M) HeLa cells stably expressing FLAG-tagged eEF1A were analyzed for polysomal profile. 80 S and polysomes are indicated. B, total protein extracted from each of 22 sucrose gradient fractions was resolved on a 10% SDS-PAGE followed by immunoblot analysis using anti-FLAG antibody. Shown in percents is the fraction of polysome-bound to total eEF1A intensity. The data represent one of two independent experiments. C, FLAG-tagged eEF1A was immunoprecipitated from NS and M HeLa cells using anti-FLAG antibody. RNA was extracted from the immunoprecipitates by TRIzol reagent spiked with a low-molecular-weight RNA ladder to monitor extraction efficiency. RNA was then resolved on an 8 m urea-12% polyacrylamide gel followed by blotting and hybridization with 32P-labeled DNA oligonucleotide corresponding to lysyl tRNA (bottom left panel). Equivalent amounts of FLAG-eEF1A immunoprecipitates were confirmed by immunoblotting with anti-FLAG antibody (top left panel). Equivalent loading of extracted RNA was confirmed by methylene blue staining (middle left panel). Shown is one representative of three independent experiments. Intensity of FLAG-eEF1A and lysyl tRNA signals was quantified by densitometry. The bar graph shows the mean ± S.E. of eEF1A-bound lysyl tRNA in mitotic relative to non-synchronized cells.
FIGURE 4.
FIGURE 4.
Level and migration pattern of eEF1 subunits. A, HeLa cells were synchronized to the G1/S boundary using DTB and harvested at the indicated time points following release from the block. 40 μg of total protein at each time point were subjected to immunoblot analysis using antibodies specific to the indicated proteins. B, eEF1D was immunoprecipitated from non-synchronized HeLa cells expressing FLAG-tagged wild-type eEF1D. The Sepharose beads-associated FLAG-eEF1D was then incubated with buffer alone or with lysate from non-synchronized (NS) or mitotic (M) HeLa cells either in the absence or presence of roscovitine, a specific CDK1 inhibitor. The beads-associated FLAG-eEF1D was then subjected to immunoblot analysis using anti-FLAG antibody. C, total protein from HeLa cells stably expressing FLAG-tagged eEF1D wild-type and T147A, S133A, T147A;S133A, and S133E was subjected to immunoblot analysis using anti-FLAG antibody. D, total protein from non-synchronized (NS) and mitotic (DTB/2me2) HeLa cells was subjected to immunoblot analysis using anti-phospho-H3 (P-H3) and anti-eEF1D antibodies.
FIGURE 5.
FIGURE 5.
eEF1D variants and their interaction with eEF1A. A, a fraction of total protein used for immunoprecipitation (input) and the anti-FLAG immunoprecipitates (IP Flag) from non-synchronized (NS) and mitotic (M) HeLa cells expressing FLAG-tagged wild-type and T147A;S133A mutant eEF1D were immunoblotted using anti-eEF1A and anti-FLAG antibodies. B, similar to A but with HeLa cells expressing FLAG-tagged T147A or S133A mutant variants of eEF1D, respectively. C, similar to A but with HeLa cells expressing the FLAG-tagged S133E mutant variant of eEF1D. A–C represent one of three independent experiments. The intensity of bands from all experiments was quantified by densitometry. Quantitative data is represented as mean ± S.E. D, representative single-plane images (×100 magnification) of fixed non-synchronized HeLa cells stained with anti-eEF1D and anti-eEF1A taken using a spinning disc confocal microscope. Pearson's coefficients for the colocalization of eEF1D and eEF1A in 15 interphase and 15 mitotic cells is shown. Data are represented as mean ± S.E.
FIGURE 6.
FIGURE 6.
Mitosis-specific reduced binding of eEF1A to its GEF is specific to eEF1A-eEF1D interaction. A fraction of total protein used for immunoprecipitation (input) and the anti-FLAG immunoprecipitates (IP Flag) from non-synchronized (NS) and mitotic (M) HeLa cells stably expressing FLAG-eEF1A (A), FLAG-eEF1B2 (B), or FLAG-eEF1G (C) were immunoblotted for the indicated proteins. Images represent one of three or four independent experiments. The intensity of bands from all experiments was quantified by densitometry. Quantitative data is represented as mean ± S.E.
FIGURE 7.
FIGURE 7.
Overexpression of the wild-type and S133A mutant of eEF1D reverse mitotic depletion of eEF1A from polysomes. Non-synchronized (NS) and mitotic (M) HeLa cells or HeLa cells expressing either FLAG-tagged wild-type or S133A eEF1D were analyzed for their polysomal profile. Shown is one representative of two independent experiments. For each profile, the area under the curve of polysomal RNA (P) peaks and subpolysomes (SP) peaks (containing free RNA, 40 S, and 60 S, ribosomal subunits) was calculated. P/(SP+P) for NS and M cells is presented as mean ± S.E. For each profile, fractions containing polysomes (P) or subpolysomes (SP) were pooled, followed by total protein extraction from each pool. 10% of the SP samples or 100% of the P samples were resolved on a 10% SDS-PAGE followed by immunoblot analysis using anti-eEF1A and anti-PABP antibody.

References

    1. Marash L., Liberman N., Henis-Korenblit S., Sivan G., Reem E., Elroy-Stein O., Kimchi A. (2008) Mol. Cell 30, 447–459 - PubMed
    1. Sivan G., Elroy-Stein O. (2008) Cell Cycle 7, 741–744 - PubMed
    1. Pyronnet S., Dostie J., Sonenberg N. (2001) Genes Dev. 15, 2083–2093 - PMC - PubMed
    1. Datta B., Datta R., Mukherjee S., Zhang Z. (1999) Exp. Cell Res. 250, 223–230 - PubMed
    1. Sivan G., Kedersha N., Elroy-Stein O. (2007) Mol. Cell. Biol. 27, 6639–6646 - PMC - PubMed

Publication types

MeSH terms

LinkOut - more resources