. 2011 Jul 15;187(2):733-47.
doi: 10.4049/jimmunol.1002701. Epub 2011 Jun 10.

Functional specializations of intestinal dendritic cell and macrophage subsets that control Th17 and regulatory T cell responses are dependent on the T cell/APC ratio, source of mouse strain, and regional localization

Affiliations

Functional specializations of intestinal dendritic cell and macrophage subsets that control Th17 and regulatory T cell responses are dependent on the T cell/APC ratio, source of mouse strain, and regional localization

Timothy L Denning et al. J Immunol. .

Abstract

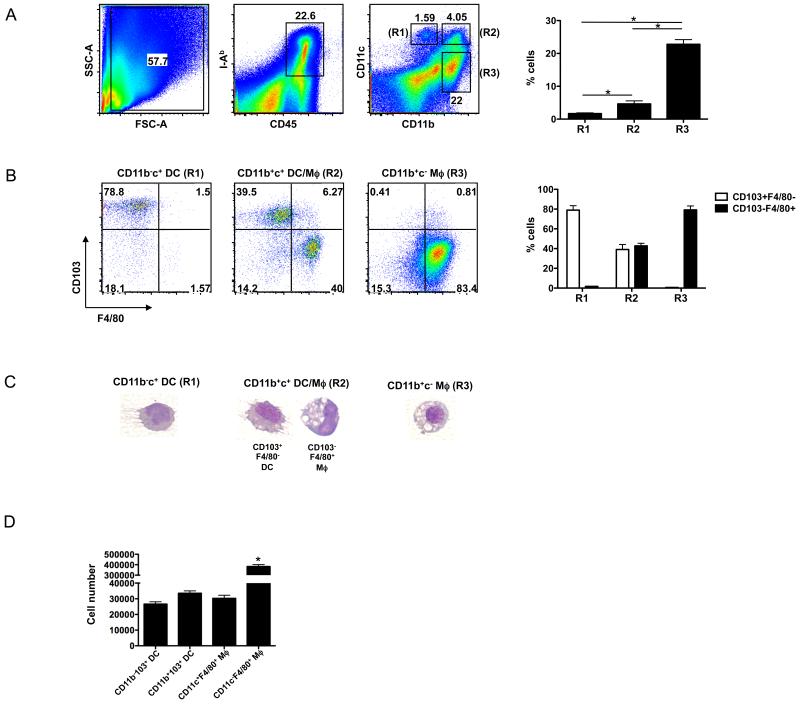
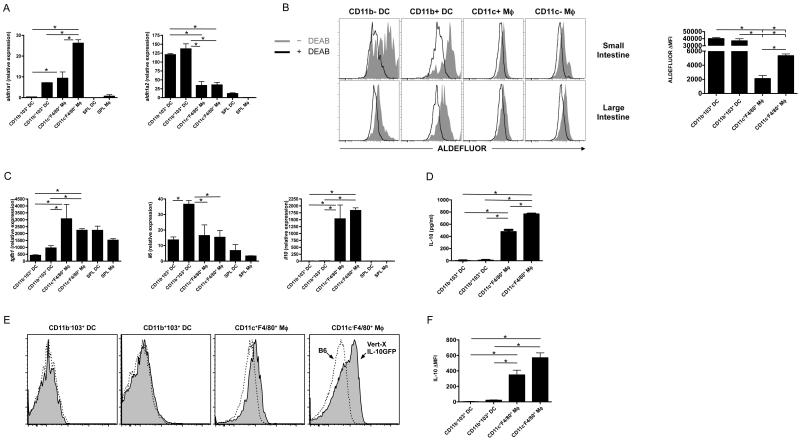
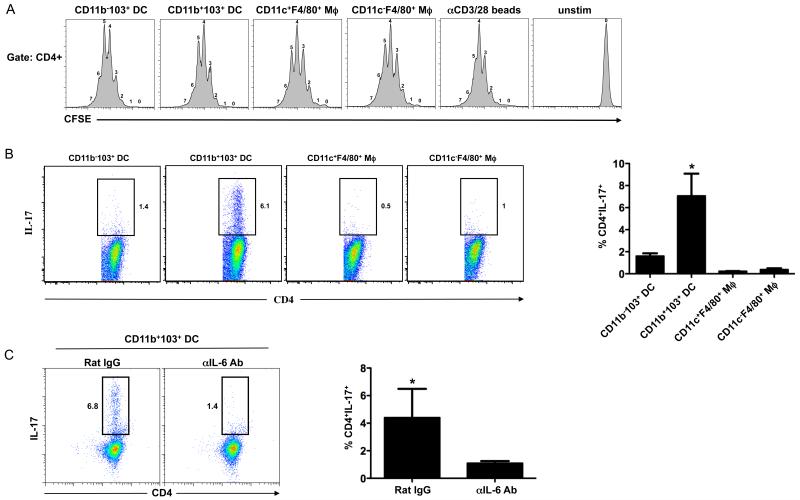
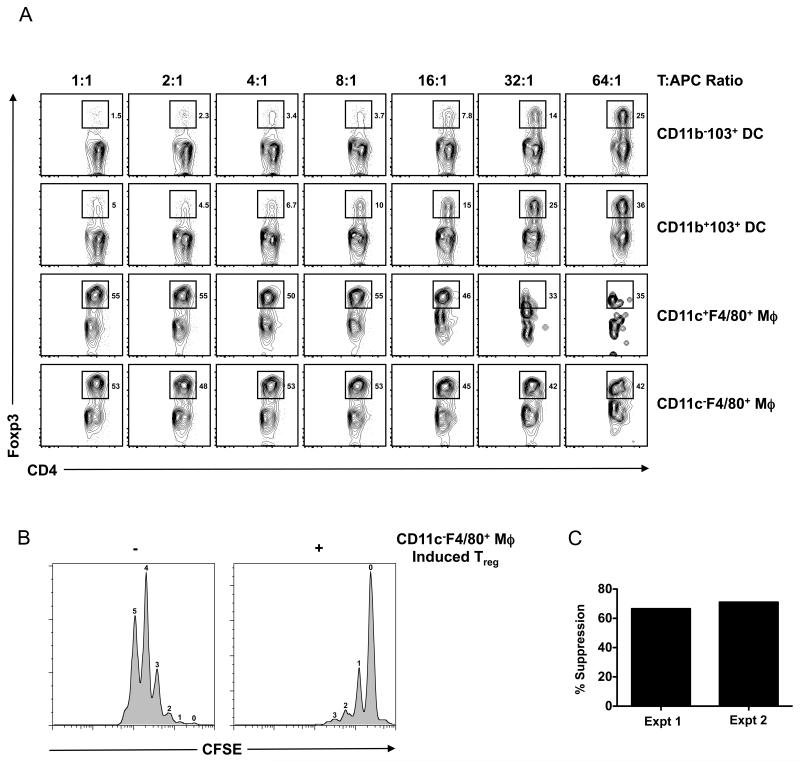
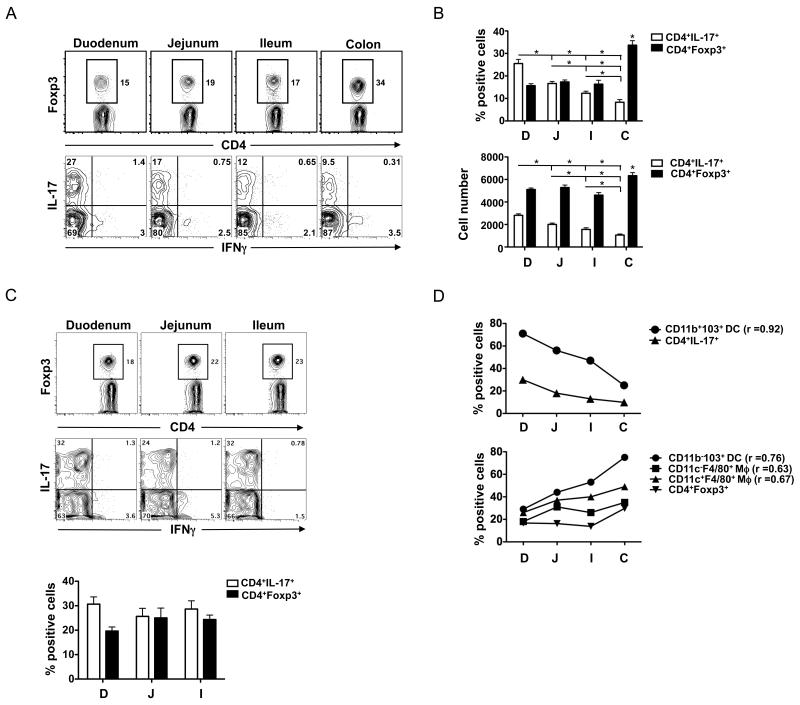
Although several subsets of intestinal APCs have been described, there has been no systematic evaluation of their phenotypes, functions, and regional localization to date. In this article, we used 10-color flow cytometry to define the major APC subsets in the small and large intestine lamina propria. Lamina propria APCs could be subdivided into CD11c(+)CD11b(-), CD11c(+)CD11b(+), and CD11c(dull)CD11b(+) subsets. CD11c(+)CD11b(-) cells were largely CD103(+)F4/80(-) dendritic cells (DCs), whereas the CD11c(+)CD11b(+) subset comprised CD11c(+)CD11b(+)CD103(+)F4/80(-) DCs and CD11c(+)CD11b(+)CD103(-)F4/80(+) macrophage-like cells. The majority of CD11c(dull)CD11b(+) cells were CD103(-)F4/80(+) macrophages. Although macrophages were more efficient at inducing Foxp3(+) regulatory T (T(reg)) cells than DCs, at higher T cell/APC ratios, all of the DC subsets efficiently induced Foxp3(+) T(reg) cells. In contrast, only CD11c(+)CD11b(+)CD103(+) DCs efficiently induced Th17 cells. Consistent with this, the regional distribution of CD11c(+)CD11b(+)CD103(+) DCs correlated with that of Th17 cells, with duodenum > jejunum > ileum > colon. Conversely, CD11c(+)CD11b(-)CD103(+) DCs, macrophages, and Foxp3(+) T(reg) cells were most abundant in the colon and scarce in the duodenum. Importantly, however, the ability of DC and macrophage subsets to induce Foxp3(+) T(reg) cells versus Th17 cells was strikingly dependent on the source of the mouse strain. Thus, DCs from C57BL/6 mice from Charles River Laboratories (that have segmented filamentous bacteria, which induce robust levels of Th17 cells in situ) were more efficient at inducing Th17 cells and less efficient at inducing Foxp3(+) T(reg) cells than DCs from B6 mice from The Jackson Laboratory. Thus, the functional specializations of APC subsets in the intestine are dependent on the T cell/APC ratio, regional localization, and source of the mouse strain.


Figures

FIGURE 1
FIGURE 1
Characterization of intestinal LP DC and macrophage subsets. Cells were isolated from the total small intestine and stained with 9 antibodies plus a vital dye (Alexa 430). A) The upper panel displays cells pre-gated on live cells, then gated on CD45 and I-Ab positive cells and then analyzed for CD11b and CD11c expression. Data from 5 independent experiments for specific regions (R1, R2, R3) corresponding to FACS plots in A) are plotted as means ± SEM (* p < 0.05). B) Indicated populations of cells expressing various levels of CD11b and CD11c were further analyzed for F4/80 and CD103 expression as shown. Data from 5 independent experiments for specific populations (CD103+F4/80 or CD103F4/80+) corresponding to R2 in A) are plotted as means ± SEM (* p < 0.05). C) Indicated cell populations from panel B were FACS-sorted and analyzed using Geimsa stain to detail cell morphology. Data are representative of two independent experiments. D) Absolute cell numbers of indicated cell populations obtained from three independent experiments with 4 mice per experiment. Bars indicate means ± SEM. (* p < 0.05).
FIGURE 2
FIGURE 2
Expression of immunoregulatory cytokines and retinoic acid generating enzymes by LP DCs and macrophages. A) RNA was isolated from FACS-sorted CD11b LP DCs, CD11b+ LP DCs, CD11c+ LP Mφ, CD11c LP Mφ, or splenic (SPL) DCs or macrophages (Mφ) and expression of aldh1a1 and aldh1a2 were analyzed by quantitative real-time PCR. Values are expressed relative to gapdh. Bars indicate means ± SEM (* p < 0.05) from one of two independent experiments. B) ALDH activity on FACS-sorted CD11b LP DCs, CD11b+ LP DCs, CD11c+ LP Mφ, CD11c LP Mφ cells without (filled grey) or with (open black) the addition of the DEAB inhibitor. Mean fluorescence intensity (MFI) data from two independent experiments are summarized as means ± SEM (* p < 0.05). ALDEFLUOR ΔMFI was calculated by subtracting the MFI for DEAB treated samples from the MFI for the corresponding non-DEAB treated samples. C) RNA was isolated from FACS-sorted CD11b LP DCs, CD11b+ LP DCs, CD11c+ LP Mφ, CD11c LP Mφ, or splenic (SPL) DCs or macrophages (Mφ) and expression of tgfb1, il6 and il10, were analyzed by quantitative real-time PCR. Values are expressed relative to gapdh. Bars indicate means ± SEM (* p < 0.05) from one of two independent experiments. D) FACS-sorted CD11b LP DCs, CD11b+ LP DCs, CD11c+ LP Mφ, CD11c LP Mφ were cultured for 24 hours and supernatant was analyzed for IL-10 using ELISA. Bars indicate means ± SEM (* p < 0.05) from one of two independent experiments. E) Cells were isolated from the total small intestine of IL-10–IRES-EGFP reporter mice (Vert-X mice) reporter mice and analyzed by flow cytometry. Histograms are pre-gated on live cells, CD45 and I-Ab positive cells and then into indicated subsets based on CD11b, CD11c, CD103 and F4/80 expression as defined in Figure 1. Data from two independent experiments are summarized as means ± SEM (* p < 0.05).
FIGURE 3
FIGURE 3
LP DC and macrophage induced T cell proliferation and differentiation. A) OT-II T cell proliferation induced by LP DCs and macrophages. CFSE dilution of OT-II T cells 90 hours after co-culture with FACS-sorted CD11b LP DCs, CD11b+ LP DCs, CD11c+ LP Mφ, CD11c LP Mφ cells, αCD3/28 beads, or left unstimulated (unstim). Data are representative of two independent experiments. B) Flow cytometry of the intracellular production of IL-17 by FACS-sorted CD11b LP DCs, CD11b+ LP DCs, CD11c+ LP Mφ, CD11c LP Mφ cells co-cultured for 4 d with OT-II T cells and OVA and then restimulated for 6 h with PMA and ionomycin. Numbers next to FACS plots indicate percent IL-17 positive cells in each plot. Data from three independent experiments are summarized as means ± SEM and plotted in the lower panel bar graph. (* p < 0.05). C) TH-17 cell differentiation by CD11b+CD103+ LP DCs is IL-6 dependent. Assays were performed as in A) in the presence of Rat IgG (isotype control) or anti IL-6 antibody (αIL-6 Ab). FACS data are representative of three independent experiments with the means from all experiments ± SEM plotted in the lower panel bar graph. (* p < 0.05).
FIGURE 4
FIGURE 4
Foxp3+ Treg cell differentiation by LP DCs and macrophages is ratio dependent. A) Intracellular staining and flow cytometry to assess Foxp3 expression by naïve OT-II CD4+ T cells co-cultured with FACS-sorted CD11b LP DCs, CD11b+ LP DCs, CD11c+ LP Mφ, CD11c LP Mφ cells and OVA in the presence of TGF-β for 4 d. Numbers along the top row indicate the T cell to APC (T:APC) ratio. Numbers next to boxes indicate percent CD4+FoxP3+ cells in each plot. Data are representative of three independent experiments. B) CFSE labeled naïve polyclonal CD4+CD45.1+ splenic T cells were stimulated with CD11c+ splenic DCs and anti-CD3ε for 48 hours in the absence (−) or presence (+) of putative Treg cells induced by CD11c LP macrophages as outlined in (A) at a ratio of 1:1 (responder:suppressor). Data are representative of two independent experiments. C) % suppression of CFSE labeled naïve CD4+ T cell proliferation by CD11c LP macrophage induced Treg cells in two independent experiments (Expt 1 and Expt 2).
FIGURE 5
FIGURE 5
TH-17 and Foxp3+ Treg cell differentiation by LP DCs and macrophages is dependent on source of mouse strain. Intracellular staining and flow cytometry to assess TH-17 and Foxp3 expression by naïve OT-II CD4+ T cells co-cultured with FACS-sorted CD11bCD11c+ or CD11b+CD11c+ LP cells and OVA in the absence (TH-17) or presence (Foxp3) of TGF-β for 4 d. Intestinal LPL were isolated directly stained for Foxp3 without restimulation (A) or restimulated in vitro with PMA and ionomycin for 5 hours and stained for IL-17 (B). All panels are pre-gated on TCRβ+CD4+ cells. Numbers next to boxes indicate percent positive cells in each plot. Data are representative of two independent experiments with the means ± SEM plotted in the lower panel bar graphs (* p < 0.05). C) Summary of flow cytometry data of the intracellular production of IL-17 by FACS-sorted CD11b+CD103+ LP DCs from Charles River (CRL) or Jackson Laboratories (JAX) mice co-cultured for 4 d with OT-II T cells and OVA and then restimulated for 6 h with PMA and ionomycin. Data from two independent experiments are summarized as means ± SEM (* p < 0.05).
FIGURE 6
FIGURE 6
Region specific localization of LP DCs and macrophages. A) LP cells were isolated from the duodenum, jejunum, ileum, or colon, and pre-gated on live, CD45+I-Ab+ cells and then analyzed for CD11c and CD11b expression (upper panel) or F4/80 and CD103 expression among the CD11b+CD11c+ cells (lower panel). Data from three independent experiments are summarized as means ± SEM and plotted in the bar graphs (* p < 0.05). B) Absolute cell numbers for indicated populations (D:duodenum, J:jejunum, I:ileum, C:colon). Bars indicate means ± SEM (* p < 0.05) from one of two independent experiments. C) CD11c+CD103+ LP DCs isolated from indicated populations (D:duodenum, J:jejunum, I:ileum, C:colon) were subsequently analyzed for expression of CD11b. FACS data from three independent experiments are summarized as means ± SEM and plotted in the bar graphs (* p < 0.05).
FIGURE 7
FIGURE 7
Intestinal localization of TH-17 and Foxp3+ Treg cells. A) Intestinal LPL were isolated and directly stained for FoxP3 (upper panels) or restimulated in vitro with PMA and ionomycin for 5 hours and stained for IL-17 and IFN-γ (lower panels). All panels are pre-gated on TCRβ+CD4+ cells. B) Inverse correlation between the presence of Foxp3+ T cells and IL-17 producing T cells in regions of the intestine in both frequency (upper panel) and absolute cell number (lower panel). FACS data frequencies or absolute cell numbers from three independent experiments are summarized as means ± SEM and plotted in the bar graphs (* p < 0.05). C) Isolated intestinal LPL from the indicated regions of the small intestine of DSS treated mice were restimulated in vitro with PMA and ionomycin for 5 hours and stained for IL-17 and IFN-γ. Cells are pre-gated on TCRβ+CD4+ cells. FACS data from three independent experiments are summarized as means ± SEM and plotted in the bar graph. D) Positive correlation between the presence of IL-17 producing T cells and CD11b+CD103+ LP DCs in regions of the intestine. Positive correlation between Foxp3+ T cells and CD11bCD103+ LP DCs, CD11c+F4/80+ LP Mφ, and CD11cF4/80+ LP Mφ (D:duodenum, J:jejunum, I:ileum, C:colon).
Figure 8
Figure 8
Accumulation of CD11b+CD103+ LP DCs and TH-17 cells during colitis. Mice were given DSS in their drinking water for 5 days and then changed to regular water for 2 days for a total of 4 cycles. A) H&E staining was performed on tissue sections from colons of control or DSS-treated mice. B) Isolated intestinal LPL were restimulated in vitro with PMA and ionomycin for 5 hours and stained for IL-17 and IFN-γ. Cells are pre-gated on TCRβ+CD4+ cells. FACS data from three independent experiments are summarized as means ± SEM and plotted in the bar graph (* p < 0.05). C) Cells were pre-gated on live cells, then gated on CD45 and I-Ab positive cells (upper panel), CD11b and CD11c (lower panel). FACS data from three independent experiments are summarized as means ± SEM and plotted in the bar graph (* p < 0.05). D) LP DCs defined as CD11c and CD103 positive cells were subsequently analyzed for CD11b expression. FACS data from three independent experiments are summarized as means ± SEM and plotted in the bar graph (* p < 0.05). E) Absolute cell numbers for major LP DCs and LP macrophage subsets isolated from control or DSS-treated mice represent means ± SEM (* p < 0.05).

References

    1. Ivanov II, Frutos Rde L, Manel N, Yoshinaga K, Rifkin DB, Sartor RB, Finlay BB, Littman DR. Specific microbiota direct the differentiation of IL-17-producing T-helper cells in the mucosa of the small intestine. Cell Host Microbe. 2008;4:337–349. - PMC - PubMed
    1. Ivanov II, Atarashi K, Manel N, Brodie EL, Shima T, Karaoz U, Wei D, Goldfarb KC, Santee CA, Lynch SV, Tanoue T, Imaoka A, Itoh K, Takeda K, Umesaki Y, Honda K, Littman DR. Induction of Intestinal Th17 Cells by Segmented Filamentous Bacteria. Cell. 2009 - PMC - PubMed
    1. Banchereau J, Steinman RM. Dendritic cells and the control of immunity. Nature. 1998;392:245–252. - PubMed
    1. Iwasaki A, Medzhitov R. Toll-like receptor control of the adaptive immune responses. Nat Immunol. 2004;5:987–995. - PubMed
    1. Kanneganti TD, Lamkanfi M, Nunez G. Intracellular NOD-like receptors in host defense and disease. Immunity. 2007;27:549–559. - PubMed

Publication types

MeSH terms