. 2012 Mar;22(3):493-508.
doi: 10.1093/cercor/bhr057. Epub 2011 Jun 10.

Influence of a subtype of inhibitory interneuron on stimulus-specific responses in visual cortex

Affiliations

Influence of a subtype of inhibitory interneuron on stimulus-specific responses in visual cortex

Rong Mao et al. Cereb Cortex. 2012 Mar.

Abstract

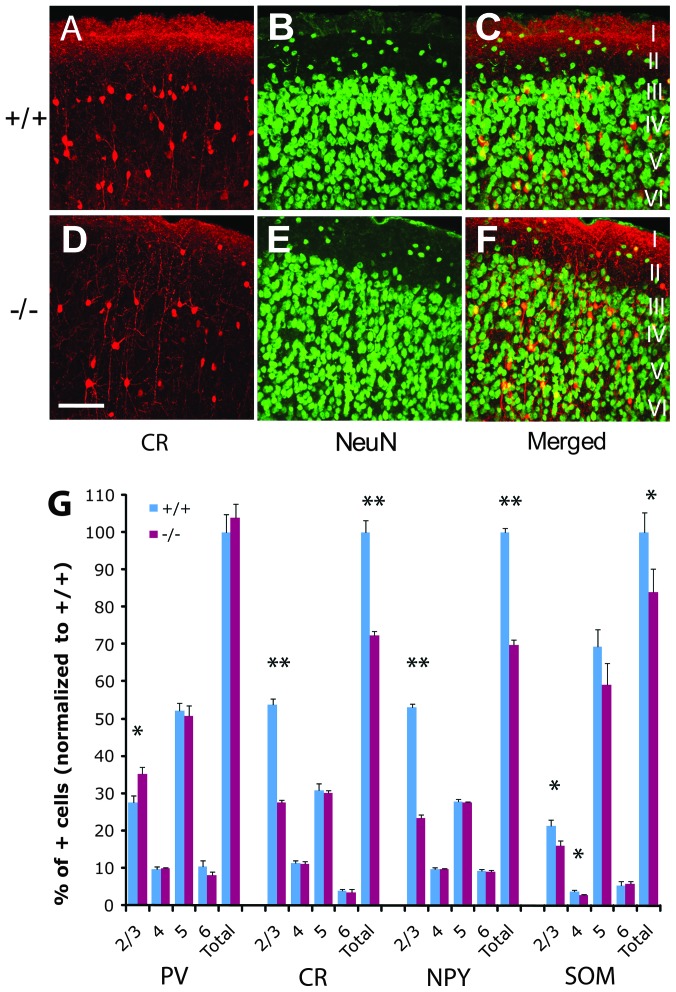
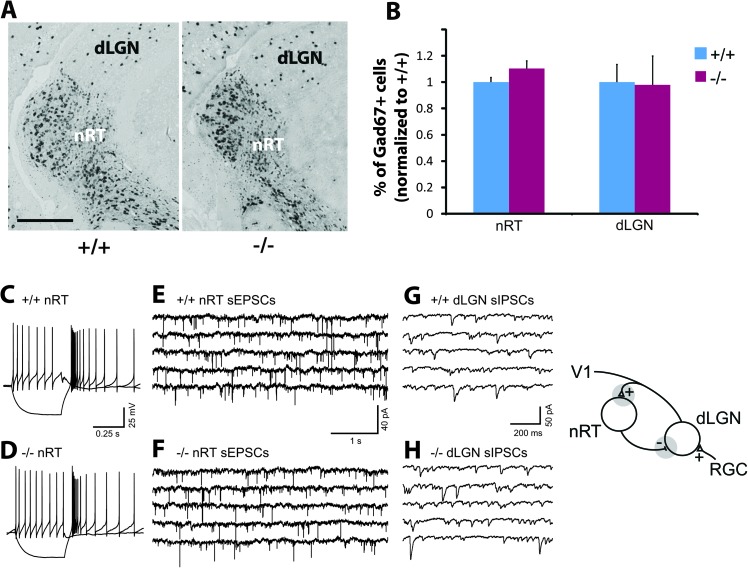
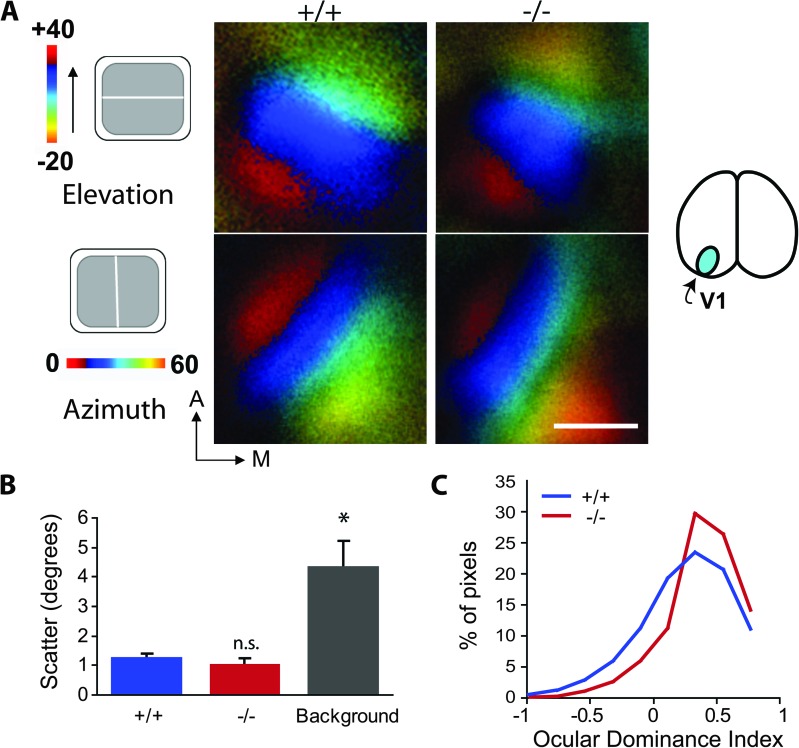
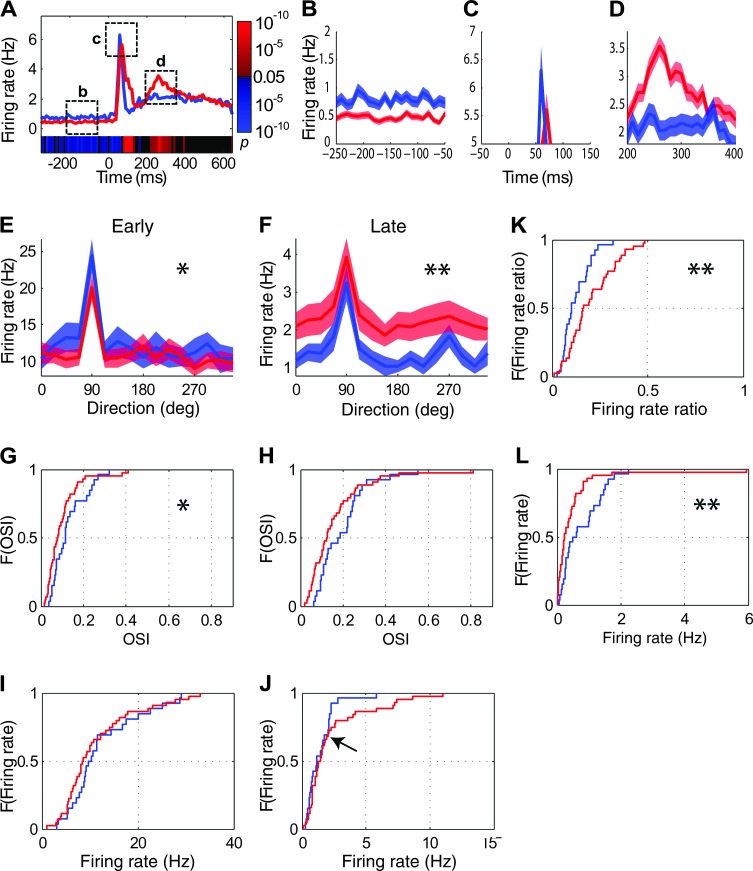
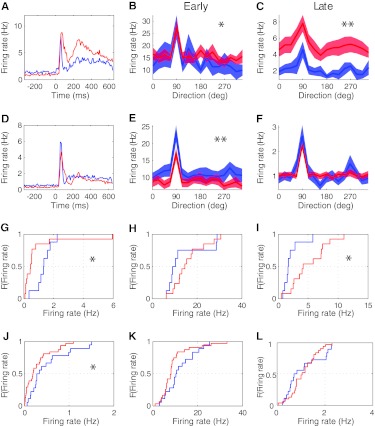
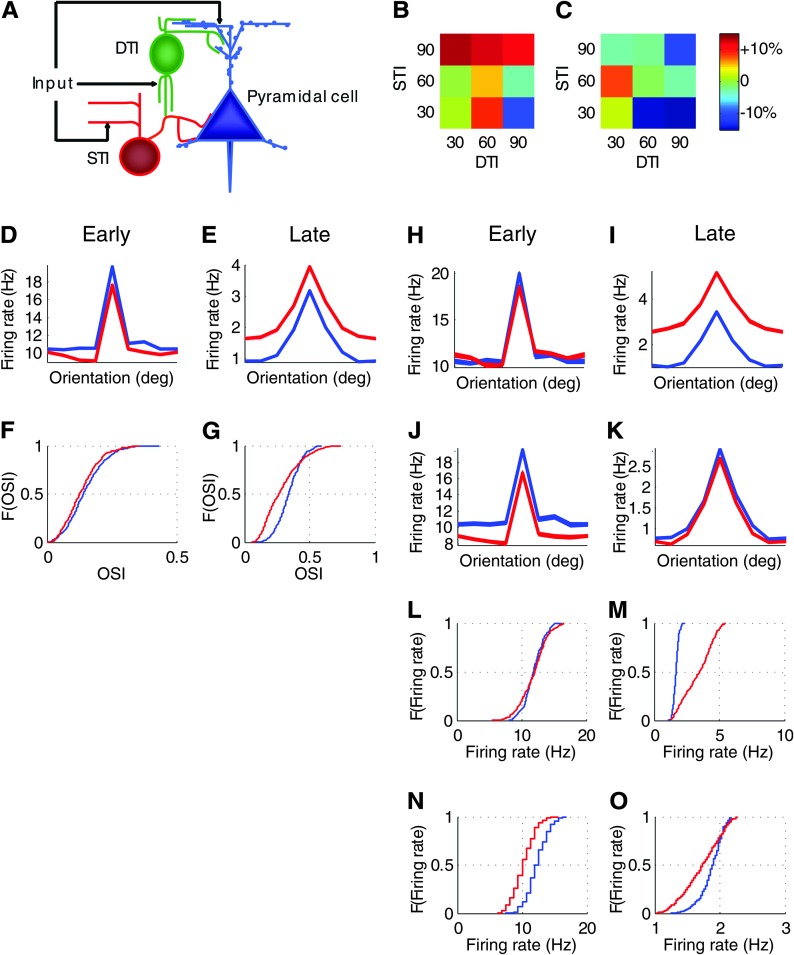
Inhibition modulates receptive field properties and integrative responses of neurons in cortical circuits. The contribution of specific interneuron classes to cortical circuits and emergent responses is unknown. Here, we examined neuronal responses in primary visual cortex (V1) of adult Dlx1(-/-) mice, which have a selective reduction in cortical dendrite-targeting interneurons (DTIs) that express calretinin, neuropeptide Y, and somatostatin. The V1 neurons examined in Dlx1(-/-) mice have reduced orientation selectivity and altered firing rates, with elevated late responses, suggesting that local inhibition at dendrites has a specific role in modulating neuronal computations. We did not detect overt changes in the physiological properties of thalamic relay neurons and features of thalamocortical projections, such as retinotopic maps and eye-specific inputs, in the mutant mice, suggesting that the defects are cortical in origin. These experimental results are well explained by a computational model that integrates broad tuning from dendrite-targeting and narrower tuning from soma-targeting interneuron subclasses. Our findings suggest a key role for DTIs in the fine-tuning of stimulus-specific cortical responses.


Figures

Figure 1.
Figure 1.
Adult Dlx1/ mice showed a partial reduction in calretinin+, NPY+, and somatostatin+ neurons in visual cortex. (AF) Examples of representative calretinin+ and NeuN+ cells, and the merged images, as shown by immunohistochemistry in wild-type (AC) and Dlx1/ littermates (DF). Scale bar: 100 μm (AF). The variation in density of calretinin staining in layer 1 is potentially due to differences in background staining/edge effects, and/or staining of neuronal processes. (G) The percents of parvalbumin+, calretinin+, NPY+, and somatostatin+ cells in each laminar layer (layers 2/3, 4, 5, and 6), normalized to that of the total number of positive neurons in Dlx1+/+ littermates, were quantified in visual cortices of Dlx1/ (n = 4) and Dlx1+/+ mice (n = 3). PV: parvalbumin+; CR: calretinin+; NPY: NPY+; SOM: somatostatin+. For all comparisons, *P < 0.05; **P < 0.01.
Figure 2.
Figure 2.
Adult Dlx1/ mice showed normal thalamic synaptic function. (A) Examples of representative Gad67+ cells, as shown by in situ hybridization, in the nRT and dLGN of the thalamus from Dlx1+/+ and Dlx1/ littermates. Scale bar: 250 μm. (B) The percents of Gad67+ cells in nRT and dLGN in the thalamus of Dlx1/ mice (n = 4), normalized to that in Dlx1+/+ littermates (n = 5), were quantified (P > 0.05 for both comparisons). (C,D) Representative current clamp recordings from individual cells in the nRT of wild-type (C) and Dlx1/ (D) mice. Both wild-type and Dlx1/ nRT cells responded to membrane hyperpolarizations with typical high frequency, long duration (>100 ms) rebound bursts of action potentials. The same nRT cells responded to depolarizing current steps with typical “tonic” firing mode with prominent fast spike after-hyperpolarizations evident. (E,F) Representative traces of whole-cell voltage clamp recordings of sEPSCs of individual neurons from nRT of wild-type (E) and Dlx1/ mice (F). Each trace contains 25 s of continuous recording with a holding potential of −85 mV when corrected for junction potential. (G,H) Representative traces of whole-cell voltage clamp recordings of sIPSCs of individual neurons from dLGN of wild-type (G) and Dlx1/ mice (H). Each trace contains 5 s of continuous recording with the membrane potential clamped at −64 mV. In schematic of the visual thalamic relay at right, gray circles represent the synaptic loci in the thalamic network that we studied.
Figure 3.
Figure 3.
Adult Dlx1/ mice showed normal retinotopic maps and binocular responses in V1. (A) Intrinsic signal optical imaging in V1 (from the same hemisphere across all animals, as indicated by the cyan area in the illustration at right) showed that Dlx1/ mice have normal retinotopy in response to a drifting horizontal or vertical bar displayed to the contralateral eye. As examples, elevation and azimuth maps from a wild-type and Dlx1/ littermate are displayed as a function of amplitude, normalized to the maximum pixel response in the field of view. Scale bar: 500 μm. (B) Average pixel scatter of retinotopic maps did not significantly differ between wild-type (n = 3) and Dlx1/ (n = 2) mice. For comparison, scatter from nonvisual cortical regions was significantly higher than scatter in V1 of wild-type and Dlx1/ mice (P < 0.05). (C) ODI pixel histograms from representative mice showed similar distributions in wild-type and Dlx1/ binocular cortex. Average ODI values from V1 of Dlx1/ versus wild-type mice (0.36 ± 0.08 vs. 0.30 ± 0.02) were not significantly different. For all panels, *P < 0.05.
Figure 4.
Figure 4.
Orientation tuning and firing rates were affected in V1 of Dlx1/ mice. (A) Average PSTH of Dlx1/ cells (red line) was altered compared with the average PSTH from wild-type controls (blue line). Visual stimuli, with an onset at 0 ms, were presented for 2 s. Color bar at bottom of histogram shows running P values comparing the 2 histograms: blue bars denote P < 0.05 in instances where Dlx1+/+ cells have higher firing rates than Dlx1/ cells; red bars denote P < 0.05 in instances where Dlx1+/+ cells have lower firing rates than Dlx1/ cells; and black bars denote P ≥ 0.05. Actual P values are shown on color bar at right. (BD) Enlargements of the 3 time windows (indicated in panel A) demonstrate the changes in firing rates of Dlx1/ cells. (E,F) Dlx1/ cells showed altered average tuning curves based on early (E) and late responses (F). Here and in Figure 5, tuning curves spanning 360° are presented to illustrate different responses at 90° and 270°, both of which are at the preferred orientation but represent opposite directions. For panels BF, the shaded areas represent mean ± SEM. (G,H) Dlx1/ cells showed lower OSI values based on early (G) and late responses (H), as indicated by the cumulative density functions (CDFs) of OSIs. For Panels GL (and similar panels in Figs 5 and 6), F on the y-axis represents CDF of OSI (G,H) or firing rates (IL). (I,J) Dlx1/ cells showed trends toward lower transient responses (I) and higher late responses (J) as indicated by the CDFs of firing rate. The arrow indicates a divergence point in the distribution (see text for details). (K) Dlx1/ cells showed higher ratios of late to early responses. (L) Dlx1/ cells showed lower spontaneous firing rates. For all panels except the color bars in panel A, blue lines depict Dlx1+/+ cells; red lines depict Dlx1/ cells. For all panels except panel A, *P < 0.05; **P < 0.01.
Figure 5.
Figure 5.
Orientation tuning and firing rates were affected differently between the top 30% of V1 cells with highest evoked firing rates and the rest (bottom 70%) of cells in Dlx1/ mice, each compared with the equivalent fraction of cells in Dlx1+/+ mice. (A) Top 30% of Dlx1+/+ (n = 8) and Dlx1/ (n = 13) cells showed very different average PSTHs. (B,C) For the top 30% of Dlx1/ cells, the average tuning curve based on late responses (B) was more affected than that based on early responses (C). (D) Bottom 70% of Dlx1+/+ (n = 18) and Dlx1/ (n = 31) cells showed similar average PSTHs. (E,F) For the bottom 70% of Dlx1/ cells, the average tuning curve based on early responses (E) was more affected than that based on late responses (F). (G) Spontaneous firing rates of the top 30% Dlx1/ cells were lower than those of Dlx1+/+ cells. (H,I) For the top 30% of Dlx1/ cells, CDFs of average evoked firing rates showed a trend toward higher early responses (H) and significantly higher late responses (I) than those of Dlx1+/+ cells. (J) The bottom 70% Dlx1/ cells showed a trend toward lower spontaneous firing rates. (K,L) For the bottom 70% of Dlx1/ cells, CDFs of average evoked firing rates showed trends toward lower early responses (K) and lower late responses (L). For all panels, blue lines depict Dlx1+/+ cells; red lines depict Dlx1/ cells. For all panels, *P < 0.05; **P < 0.01.
Figure 6.
Figure 6.
A network model, in which we varied the orientation tuning of DTIs and STIs, explains the key results in Dlx1/ mice and demonstrates the role of these interneuron subtypes in generating orientation selectivity and response levels of pyramidal neurons. (A) The basic architecture of our feed-forward model (see Materials and Methods). (B,C) After removing 33% of DTIs, changes in the OSI of pyramidal neurons during the early (B) and late responses (C) differed among 9 combinations of DTI and STI tuning properties. Numbers indicate ranges of differences (presented as ratios) between presynaptic and postsynaptic preferred orientations; the greater the number, the broader the tuning of the inhibitory neuron. Colors indicate directions (red: increase; blue: decrease; green: no change) and magnitudes (the darker the color, the greater the change) of changes in OSI. The only combination that produced lower OSI values during both early and late responses was the model with DTI = 90 and STI = 30 (both colors were blue). (DG) In this best-fit model, tuning curves and CDFs for OSIs based on early (D,E) and late responses (F,G) showed similar changes to those in our experimental data (Fig. 4; see text for details). Tuning curves spanning 180° are presented because we did not include direction selectivity in our model. (HO) The best-fit model displayed a divergence point of evoked firing rates at the 50th percentile. Changes in tuning curves (HK) and CDFs for the firing rates (LO) based on early (H,J,L,N) and late responses (I,K,M,O) of the top 50% of neurons (H,I and L,M) and the bottom 50% of neurons (J,K and N,O) were similar to those in our experimental results (Fig. 5; see text for details). For all panels in DO, blue lines depict wild-type cells; red lines depict mutant cells (after silencing one-third of DTIs).

Similar articles

Cited by

References

    1. Allison JD, Kabara JF, Snider RK, Casagrande VA, Bonds AB. GABAB-receptor-mediated inhibition reduces the orientation selectivity of the sustained response of striate cortical neurons in cats. Vis Neurosci. 1996;13(3):559–566. - PubMed
    1. Anderson JS, Carandini M, Ferster D. Orientation tuning of input conductance, excitation, and inhibition in cat primary visual cortex. J Neurophysiol. 2000;84(2):909–926. - PubMed
    1. Anderson SA, Eisenstat DD, Shi L, Rubenstein JL. Interneuron migration from basal forebrain to neocortex: dependence on Dlx genes. Science. 1997;278(5337):474–476. - PubMed
    1. Antonini A, Fagiolini M, Stryker MP. Anatomical correlates of functional plasticity in mouse visual cortex. J Neurosci. 1999;19(11):4388–4406. - PMC - PubMed
    1. Ascoli GA, Alonso-Nanclares L, Anderson SA, Barrionuevo G, Benavides-Piccione R, Burkhalter A, Buzsaki G, Cauli B, Defelipe J, Fairen A, et al. Petilla terminology: nomenclature of features of GABAergic interneurons of the cerebral cortex. Nat Rev Neurosci. 2008;9(7):557–568. - PMC - PubMed

Publication types

MeSH terms

Substances