

Abnormal structure-function relationship in spasmodic dysphonia
- PMID: 21666131
- PMCID: PMC3256408
- DOI: 10.1093/cercor/bhr120
Abnormal structure-function relationship in spasmodic dysphonia
Abstract
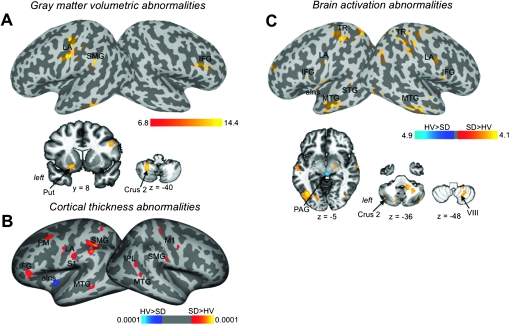
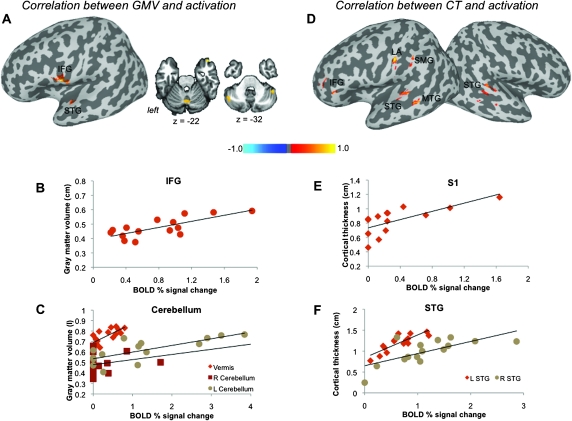
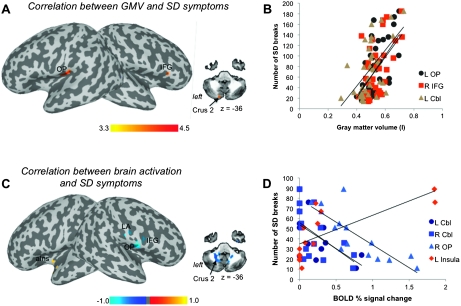
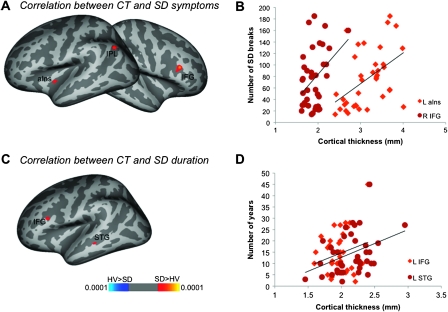
Spasmodic dysphonia (SD) is a primary focal dystonia characterized by involuntary spasms in the laryngeal muscles during speech production. Although recent studies have found abnormal brain function and white matter organization in SD, the extent of gray matter alterations, their structure-function relationships, and correlations with symptoms remain unknown. We compared gray matter volume (GMV) and cortical thickness (CT) in 40 SD patients and 40 controls using voxel-based morphometry and cortical distance estimates. These measures were examined for relationships with blood oxygen level-dependent signal change during symptomatic syllable production in 15 of the same patients. SD patients had increased GMV, CT, and brain activation in key structures of the speech control system, including the laryngeal sensorimotor cortex, inferior frontal gyrus (IFG), superior/middle temporal and supramarginal gyri, and in a structure commonly abnormal in other primary dystonias, the cerebellum. Among these regions, GMV, CT and activation of the IFG and cerebellum showed positive relationships with SD severity, while CT of the IFG correlated with SD duration. The left anterior insula was the only region with decreased CT, which also correlated with SD symptom severity. These findings provide evidence for coupling between structural and functional abnormalities at different levels within the speech production system in SD.
Figures
References
-
- Ackermann H, Riecker A. The contribution(s) of the insula to speech production: a review of the clinical and functional imaging literature. Brain Struct Funct. 2010;214:419–433. - PubMed
-
- Ali SO, Thomassen M, Schulz GM, Hosey LA, Varga M, Ludlow CL, Braun AR. Alterations in CNS activity induced by botulinum toxin treatment in spasmodic dysphonia: an H215O PET study. J Speech Lang Hear Res. 2006;49:1127–1146. - PubMed
-
- Ashburner J. A fast diffeomorphic image registration algorithm. Neuroimage. 2007;38:95–113. - PubMed
-
- Ashburner J, Friston KJ. Unified segmentation. Neuroimage. 2005;26:839–851. - PubMed
