. 2011 Jun 12;18(7):822-30.
doi: 10.1038/nsmb.2053.

An ALS-associated mutation affecting TDP-43 enhances protein aggregation, fibril formation and neurotoxicity

Affiliations

An ALS-associated mutation affecting TDP-43 enhances protein aggregation, fibril formation and neurotoxicity

Weirui Guo et al. Nat Struct Mol Biol. .

Abstract

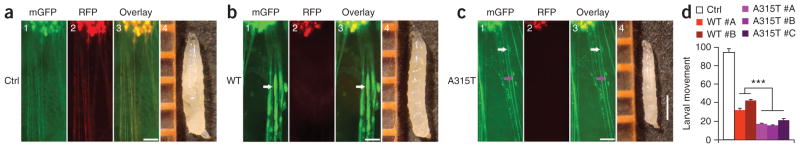
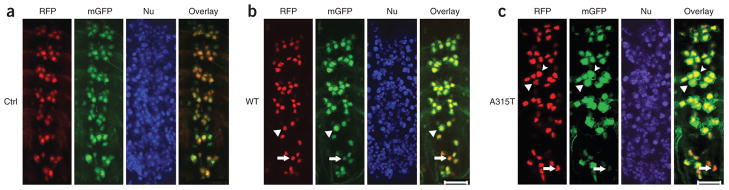
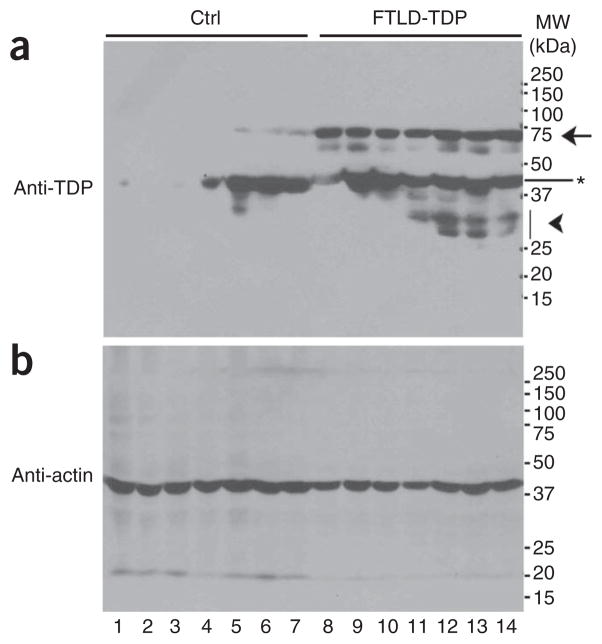
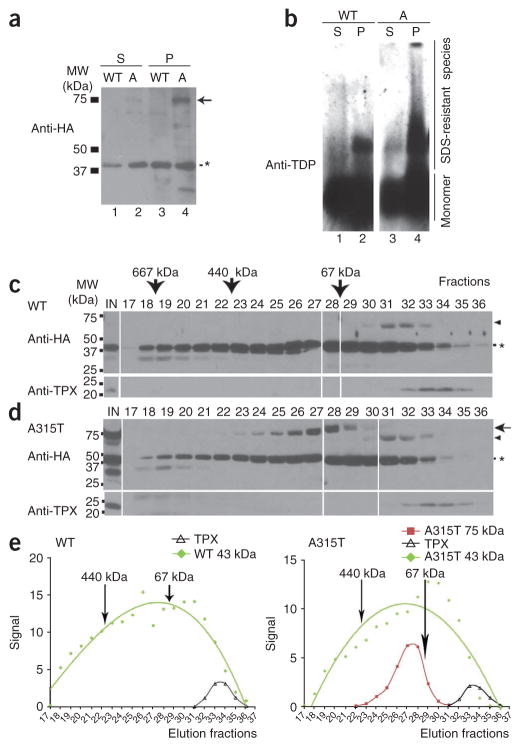
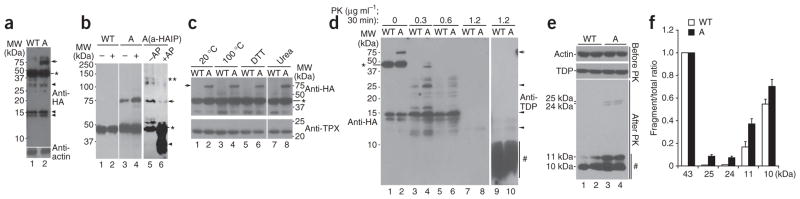
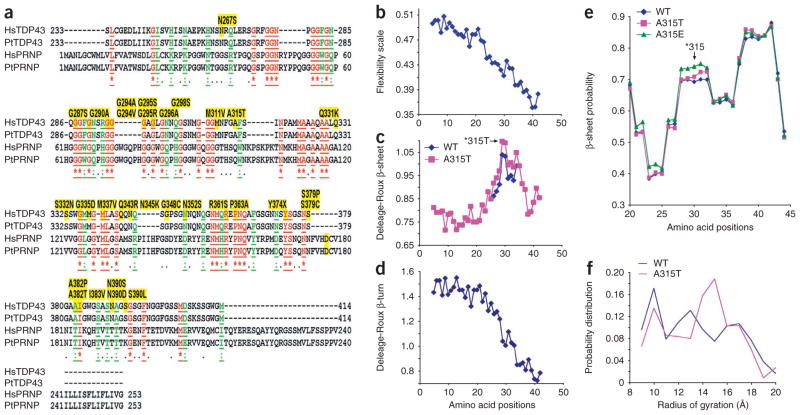
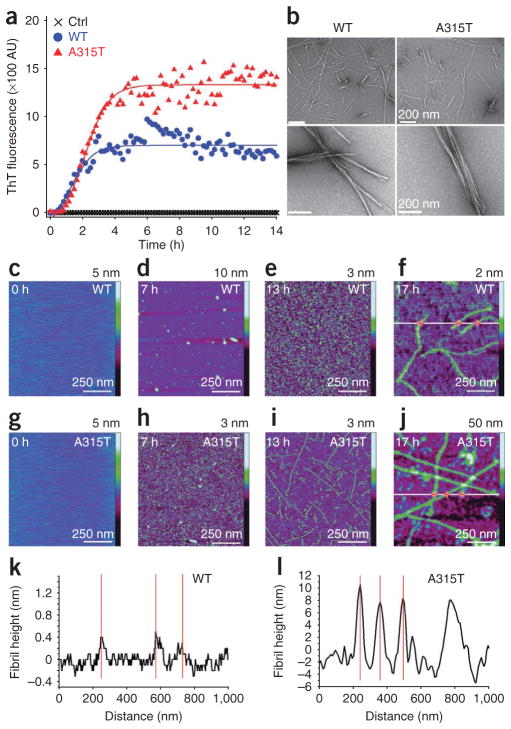
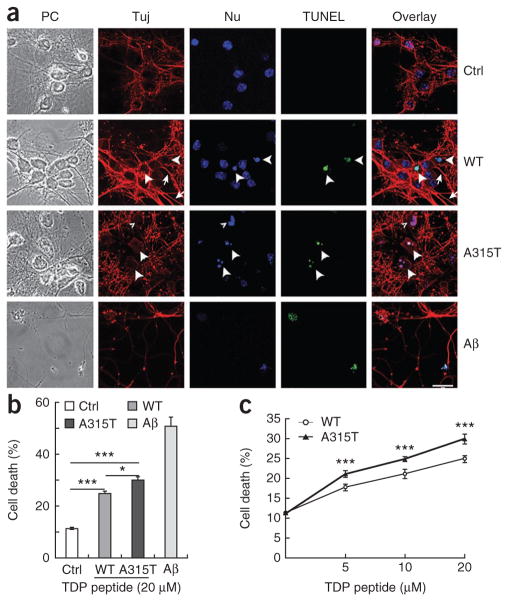
Mutations in TARDBP, encoding TAR DNA-binding protein-43 (TDP-43), are associated with TDP-43 proteinopathies, including amyotrophic lateral sclerosis (ALS) and frontotemporal lobar degeneration (FTLD). We compared wild-type TDP-43 and an ALS-associated mutant TDP-43 in vitro and in vivo. The A315T mutant enhances neurotoxicity and the formation of aberrant TDP-43 species, including protease-resistant fragments. The C terminus of TDP-43 shows sequence similarity to prion proteins. Synthetic peptides flanking residue 315 form amyloid fibrils in vitro and cause neuronal death in primary cultures. These data provide evidence for biochemical similarities between TDP-43 and prion proteins, raising the possibility that TDP-43 derivatives may cause spreading of the disease phenotype among neighboring neurons. Our work also suggests that decreasing the abundance of neurotoxic TDP-43 species, enhancing degradation or clearance of such TDP-43 derivatives and blocking the spread of the disease phenotype may have therapeutic potential for TDP-43 proteinopathies.


Conflict of interest statement

COMPETING FINANCIAL INTERESTS

The authors declare no competing financial interests.

Figures

Figure 1
Figure 1
Expression of A315T mutant hTDP-43 in motor neurons (MNs) leads to enhanced axonal damage and more severe impairment of locomotive function. (ac) MNs expressing either wild-type hTDP-43 (WT; b) or the A315T mutant (c) showed marked axon swelling (indicated by arrows) and disruption of axonal integrity, whereas MNs in vector control flies (a) showed normal axonal morphology. Fluorescence microscopic images are shown, including membrane GFP (mGFP, green; panel 1), RFP signal (red; panel 2) and overlay of images in different channels (panel 3) (scale bars, 50 μm). Axon swelling is marked by white arrows, whereas a loss of axonal integrity is marked by the purple arrow. Images of the third-instar larvae of corresponding groups are shown in panel 4, with rulers in orange (scale bar, 1 mm). (d) Flies expressing hTDP-43 in MNs show functional deficits. Two and three independent lines of flies expressing WT TDP-43 or the A315T mutant, respectively, were scored and compared with the vector control group (n = 20 in each group). Data were compared using one-way ANOVA with a Bonferroni post hoc test. A315T mutant flies showed more severe movement deficits. ***P < 0.001. Fly genotypes: control, OK371-Gal4/UAS-mGFP/UAS-RFP; WT, OK371-Gal4/UAS-mGFP/UAS-Wt-hTDP43-RFP; A315T, OK371-Gal4/UAS-mGFP/UAS-A315T-hTDP43-RFP.
Figure 2
Figure 2
Expression of the A315T mutant causes more severe motor neuron (MN) damage. (a) Control flies have normal MNs with well-organized clusters in the ventral nerve cord (VNC). mGFP, membrane GFP; red fluorescent protein, RFP; Nu, Hoechst dye nuclear staining. (b,c) MNs in third-instar larvae of transgenic flies expressing hTDP-43 show cell death and morphological abnormality in MN clusters, especially in the last three VNC segments. MN damage is much more prominent in flies expressing the A315T mutant. Arrowheads mark swollen neurons with the mGFP area enlarged. Arrows mark MNs with fragmented or condensed nuclei and reduced mGFP signals. Quantification of MNs in the last three VNC segments indicates that 79 ± 5% of MNs expressing the A315T mutant, as compared to 32 ± 3% of those expressing wild-(WT) type TDP, show cell body swelling or condensed nuclei (with six flies in each group scored in three independent experiments). Fly genotypes: a, OK371-Gal4/UAS-mGFP/UAS-RFP; b, OK371-Gal4/UAS-mGFP/UAS-TDP-43-RFP; c, OK371-Gal4/UAS-mGFP/UAS-A315T TDP-43-RFP. Scale bars, 20 μm.
Figure 3
Figure 3
FTLD-TDP brain samples show abnormal TDP-43–immunoreactive species. (a) RIPA-soluble protein lysates were prepared from postmortem brain tissues from seven control subjects and seven subjects with TDP-43–immunoreactive FTLD (see Online Methods and Supplementary Methods). Control samples were from non–cognitively impaired subjects with minimal Alzheimer’s disease pathology containing Braak & Braak tangle stages II–III, except for one with mild cognitive impairment and pathological diagnosis of early Alzheimer’s disease (lane 7). The samples were analyzed by western blotting using specific anti–TDP-43 antibodies. Several TDP-43–positive bands were detected, including the predicted band migrating at 43 kDa (*), bands migrating at ~74 kDa (arrow) and a band migrating faster than 37 kDa (arrowhead). The 74-kDa species was prominent in samples from seven of the subjects with FTLD-TDP (lanes 8–14) but was detectable at only a low level in samples from three (lanes 5–7) out of seven of the control subjects with Alzheimer’s disease (lanes 1–7). (b) Actin was used as a control showing that similar amounts of total proteins were loaded.
Figure 4
Figure 4
Biochemical characterization of TDP-43–immunoreactive species. (a) Stable HEK293 cells expressing HA-tagged wild-type or A315T hTDP-43 were lysed in RIPA buffer. The RIPA-insoluble fraction was extracted in RIPA buffer containing 2% (w/v) Sarkosyl and 500 mM NaCl. Sarkosyl-soluble (S) and Sarkosyl-insoluble pellet (P) fractions were separated by centrifugation and analyzed by western blotting using anti-HA. In addition to the expected 43-kDa band (*), a prominent band migrating at approximately 75 kDa was detected in the Sarkosyl-insoluble pellet from cells expressing A315T TDP-43 (lane 4). This 75-kDa was detected only at a low level in the Sarkosyl-soluble fraction (lane 2) and was not detectable in the cell lysates expressing wild-type TDP-43. (b) SDS-resistant aberrant TDP-43 species were detected in the Sarkosyl-insoluble pellet of lysates from cells expressing TDP-43. The Sarkosyl-soluble fractions (lanes 1 and 3) or Sarkosyl-insoluble pellets (lanes 2 and 4) from either the wild-type (lanes 1 and 2) or A315T mutant (lanes 3–4) TDP-43 cells were analyzed by semidenaturing agarose gel electrophoresis (SDD-AGE) as described followed by western blotting using a specific anti–TDP-43 antibody. Sarkosyl-insoluble fractions were extracted using 3% SDS buffer before being loaded on SDD-AGE. SDS-resistant oligomeric species (migrating slower than the monomer species) were substantially more abundant in cells expressing the A315T mutant than in those expressing the wild-type TDP-43. (c,d) RIPA-soluble fractions of cell lysates expressing either wild-type TDP-43-HA (c) or A315T TDP-43-HA (d) were loaded onto a gel filtration column with different fractions examined by western blotting using anti-HA or anti-TPX antibodies. IN, input cell lysates. The arrow and arrowheads mark the 75-kDa and 60-kDa high-molecular-weight species, respectively. The asterisk marks the expected 43-kDa monomer TDP-43 band. Some gel lanes have been omitted for reasons of space; the complete gel image is provided in Supplementary Figure 3. (e) Western blot signals in c and d were plotted for the 43-kDa species (green), 75-kDa species (red) of A315T TDP-43 and TPX band (black) for different fractions, with 440-kDa and 67-kDa size markers indicated. The 23-kDa TPX protein was detected in fractions 32–35. The aberrant 75-kDa A315T TDP-43 species was detected in fractions 24–29, corresponding to molecular weight range from 440 kDa to 67 kDa.
Figure 5
Figure 5
Cells expressing A315T TDP-43 show high-molecular-weight phosphorylated protein species that are resistant to heat, DTT and urea and produce fragments partially resistant to protease K (PK) treatment. (a) High-molecular-weight bands are detected in lysates from cells expressing A315T TDP-43. Stable cells expressing HA-tagged wild-type or A315T TDP-43 (marked by WT or A, respectively) were lysed and subjected to western blotting using anti-HA antibody. In addition to the 43-kDa band (*), both higher-molecular-weight (75 kDa, arrows) and lower-molecular-weight bands (arrowheads) were detected. The 75-kDa species were resolved into 75–76-kDa doublets on some gels. (b) The abundance of the 75-kDa species (arrow) increased when lysates from cells expressing A315T TDP-43 were treated with okadaic acid (OA) and decreased when lysates were treated with alkaline phosphatase (AP). Cells expressing HA-tagged wild-type (lanes 1 and 2) or A315T mutant (lanes 3 and 4) TDP-43 were treated with the control vehicle or OA, and cell lysates were examined by western blotting using anti-HA antibody (lanes 1–4). Lanes 5 and 6 show western blots using anti–TDP-43 of reaction products treated with control or AP, after immunoprecipitation of cell lysates from cells expressing the A315T mutant using anti-HA (a-HA IP). The 43-kDa TDP-43 (*), higher-molecular-weight species (**) and lower-molecular-weight products (arrowhead) are also shown. (c) The 75-kDa species detected in cells expressing A315T TDP-43 was not affected by treatment with heat (20 °C, lane 2; 100 °C, lane 4), 200 mM DTT (lane 6) or 6 M urea (lane 8) in the presence of protease inhibitors. (d) Increased amounts of protease Kresistant TDP-43 derivatives were detected in cells expressing the A315T mutant TDP-43. Cell lysates from the wild-type or A315T TDP-43-HA cells were treated with protease K at different concentrations, separated on SDS-PAGE and western blotted using either anti-HA (lanes 18) or anti–TDP-43 (lanes 9 and 10) antibodies. Although the 75-kDa and 43-kDa TDP-43 species are sensitive to protease K treatment, a number of lower-molecular-weight bands, especially TDP-43–reactive species (5–10 kDa), are resistant to protease K (lanes 9–10). Representative bands partially resistant to protease K including 2524 kDa, 1514 kDa and 1312 kDa are marked by arrowheads; a cluster of TDP-43 reactive bands ~510 kDa are marked by #. (e) Western blotting of cell lysates using anti-HA after treatment with protease K at 1 μg ml−1, with lanes 1 and 2, and lanes 3 and 4, containing duplicates of reactions. (f) Quantification of western blotting signals of protease K–resistant bands in e. Shown is the ratio of the corresponding band to the total amounts of signals including the full-length 43-kDa band, demonstrating that partially protease K–resistant bands (2524 kDa or 1110 kDa) were more abundant in cells expressing the A315T TDP-43 (black bars, A) than in those expressing wild-type TDP-43 (white bars, wild type). Error bars, s.e.m.
Figure 6
Figure 6
Sequence features and structural prediction of the C-terminal fragments of TDP-43. Molecular dynamics (MD) simulation of TDP-43 synthetic peptides corresponding to residues 286331 suggests that the A315T mutation increases the tendency of the protein to form β-sheet structures and to stay in extended conformation(s). (a) The alignment of peptide sequences of the C-terminal domain of TDP-43 (Ser233Met414) with the prion proteins (PRNP) from Homo sapiens (Hs) and Pan troglodytes (Pt) reveals a moderate level of sequence similarity. The identical amino acid residues are in red and underlined; similar residues are in green and underlined. Proteinopathy-associated mutations of TDP-43 are shown as yellow highlighted residues above the corresponding region. (bd) The peptide properties as predicted using the Protscale server of the Swiss Institute of Bioinformatics (SIB). The synthetic 46-mer peptides of either wild-type (blue) or the A315T mutant (pink) TDP-43 were analyzed for the flexibility scale, as described by Bhaskaran and Ponnuswamy, and for predicted β-sheet and β-turn, using the Deleage-Roux scale. The peptide profiles were smoothened using an equal-weight sliding window of nine amino acids. (e) The β-sheet probability of amino acid residues in TDP-43 peptides as further analyzed using a Ramachandran plot. A residue is defined as having a β-sheet structure when −150 < φ < −60 and 100 < ϕ < 170 on the Ramachandran plot. The probability of 1 means that the residue is 100% in β-sheet conformation during the course of MD simulation. The blue, pink and green lines represent statistics from simulations of the wild type, the A315T mutant and the A315E mutant, respectively. The 46-mer peptides were analyzed in their entirety; data are shown for amino acid positions 20–45, corresponding to amino acid 306–330 (note that amino acid position 30 corresponds to A315T in TDP-43 protein, as marked by ‘*315’ with an arrow). (f) The probability distribution of the radius of gyration of the TDP-43 peptides by MD simulation. The radius of gyration is defined as the root-mean-square distance of the collection of atoms from their common center of gravity. Radii of gyration in the range of 9–11 Å and 12–20 Å correspond to collapsed and extended conformations, respectively. The radii of gyration were calculated using the 46-mer peptide. The A315T mutant shows higher probability at 14–16 Å of radius of gyration, suggesting its higher tendency to stay extended.
Figure 7
Figure 7
Synthetic TDP-43 peptides (wild-type or A315T mutant, Gln286–Gln331) form fibrils in vitro. (a) Time course of ThT binding of synthetic TDP-43 peptides. The wild-type (blue circles) or A315T mutant (red triangles) TDP-43 peptides or the control peptide (black crosses) is presented with dynamic changes in ThT binding at 37 °C. (b) EM images of fibrils formed with the wild-type or A315T TDP-43 peptides. Higher magnification is shown below. Scale bars, 200 nm. (c–j) Time-lapse AFM reveals dynamic process of protofibril and fibril formation of TDP-43 peptides. Time-lapse AFM images of wild-type TDP-43 (cf) and A315T mutant TDP-43 synthetic peptide (gj) during the formation of protofibrils and fibrils after incubation of peptides in aqueous solution at a concentration of 20 mM for 0, 7 h, 13 h and 17 h. All the images were obtained on a mica surface. (k,l) Corresponding cross-sectional profiles for the wild-type (f) and A315T mutant (j) TDP-43 peptides along the white lines, respectively. Z scale bars for the AFM images are as marked on the right. Red crosses in f and j mark the locations for the height measurements, which correspond to the red lines in k and l.
Figure 8
Figure 8
The A315T mutant synthetic TDP-43 peptide causes enhanced neurotoxicity as compared to the wild-type peptide in primary cortical neuronal cultures. (a) Fluorescence microscopic images of primary cortical neurons treated with the control peptide, wild-type TPD-43 peptide, phosphorylated A315T TDP-43 peptide or amyloid1–42 peptide (Ctrl, WT, A315T and Aβ42, respectively). Microscopic images corresponding to phase-contrast images (PC), Tuj1 immunostaining, Hoechst dye nuclear staining (Nu), TUNEL staining and the superimpositions of the corresponding groups of images are shown. The large arrowheads mark TUNEL-positive neurons undergoing cell death, whereas the small arrowhead in the A315T group marks an abnormal nucleus that is TUNEL negative. Neurites with normal morphology are marked by arrows. Most neurites in the A315T group were damaged, showing either abnormal varicosities or disruption of normal integrity. Scale bar, 20 μm. (b,c) Quantification of neuronal death as the percentage of TUNEL-positive neurons in the corresponding groups shown in a. The graph shows average values ± s.e.m. of data collected from three independent experiments. Statistical analysis in b was performed with one-way ANOVA with Tukey post hoc test, and that in c with two-way ANOVA with Bonferroni post hoc test. ***P < 0.001; *P < 0.05.

References

    1. Harvey RJ, Skelton-Robinson M, Rossor MN. The prevalence and causes of dementia in people under the age of 65 years. J Neurol Neurosurg Psychiatry. 2003;74:1206–1209. - PMC - PubMed
    1. Mackenzie IR, et al. Nomenclature and nosology for neuropathologic subtypes of frontotemporal lobar degeneration: an update. Acta Neuropathol. 2010;119:1–4. - PMC - PubMed
    1. Arai T, et al. TDP-43 is a component of ubiquitin-positive tau-negative inclusions in frontotemporal lobar degeneration and amyotrophic lateral sclerosis. Biochem Biophys Res Commun. 2006;351:602–611. - PubMed
    1. Neumann M, et al. Ubiquitinated TDP-43 in frontotemporal lobar degeneration and amyotrophic lateral sclerosis. Science. 2006;314:130–133. - PubMed
    1. Kwiatkowski TJ, Jr, et al. Mutations in the FUS/TLS gene on chromosome 16 cause familial amyotrophic lateral sclerosis. Science. 2009;323:1205–1208. - PubMed

Publication types