. 2011 Jun 12;7(7):437-44.
doi: 10.1038/nchembio.585.

A biosensor generated via high-throughput screening quantifies cell edge Src dynamics

Affiliations

A biosensor generated via high-throughput screening quantifies cell edge Src dynamics

Akash Gulyani et al. Nat Chem Biol. .

Erratum in

  • Nat Chem Biol. 2012 Aug;8(8):737

Abstract

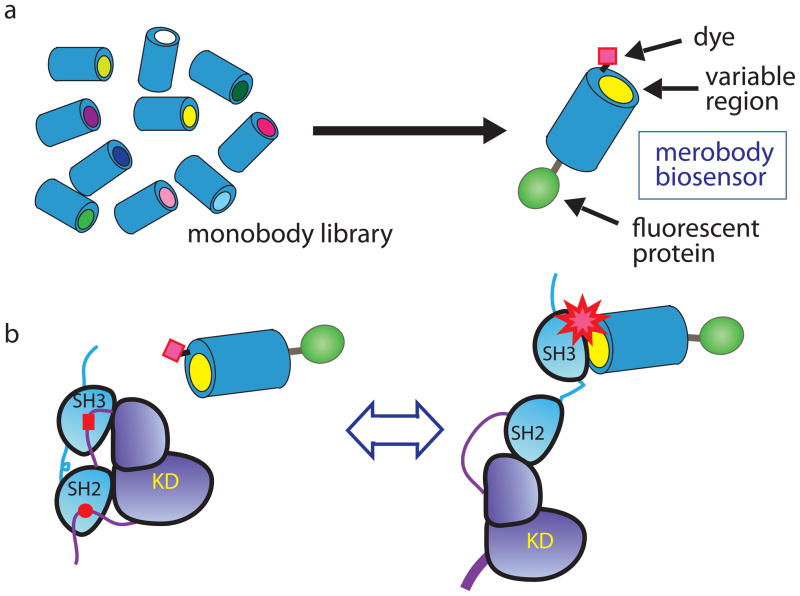
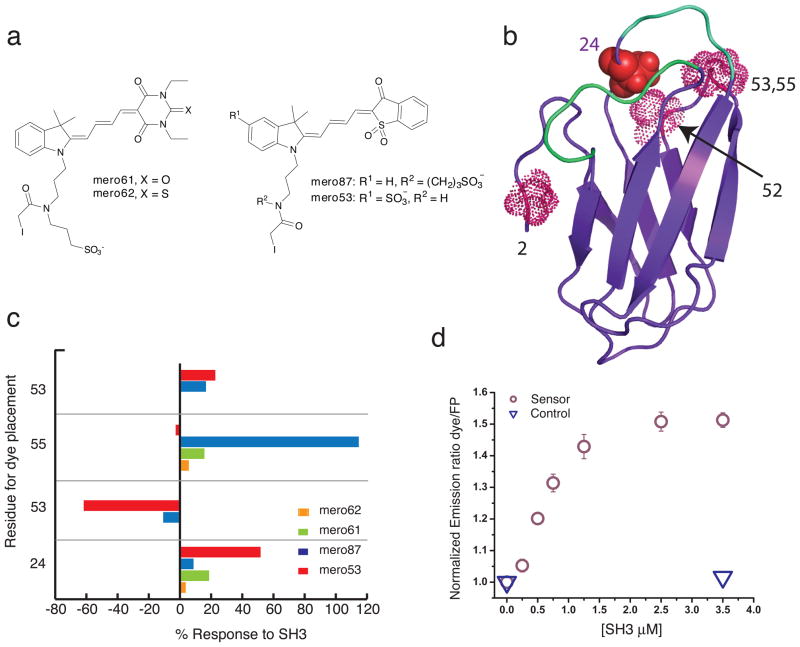
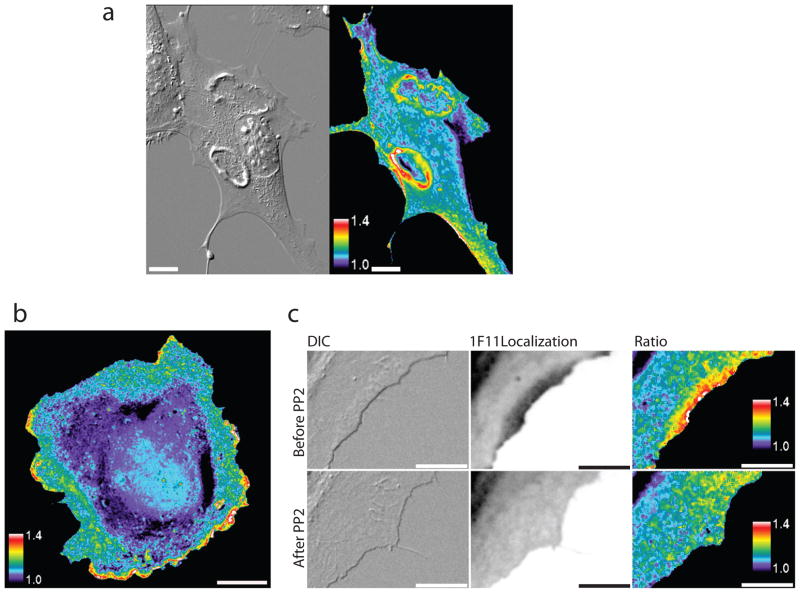
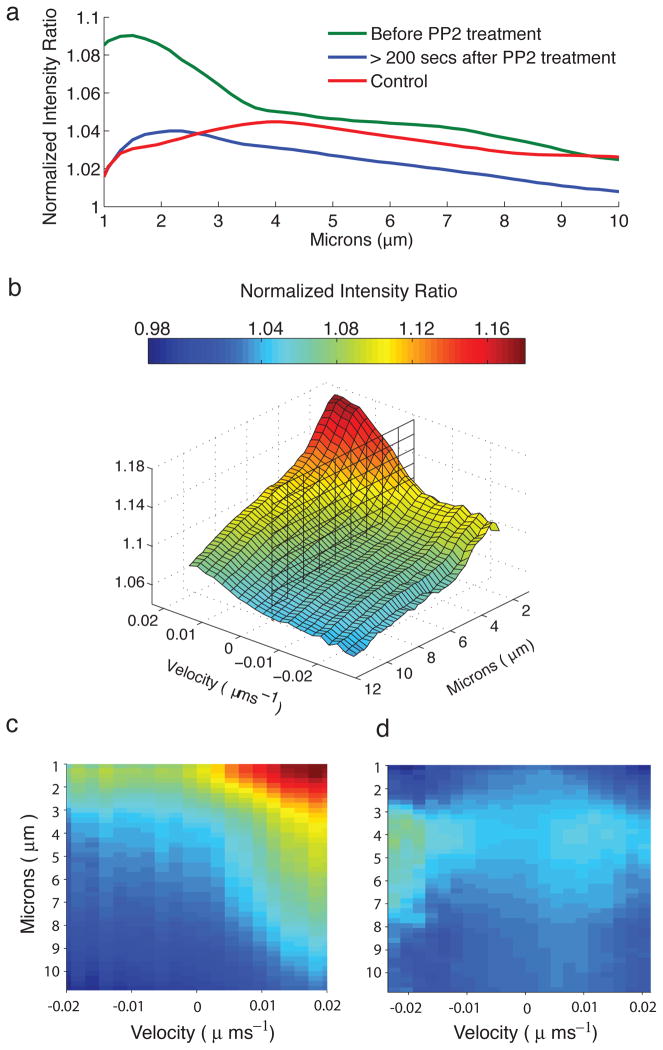
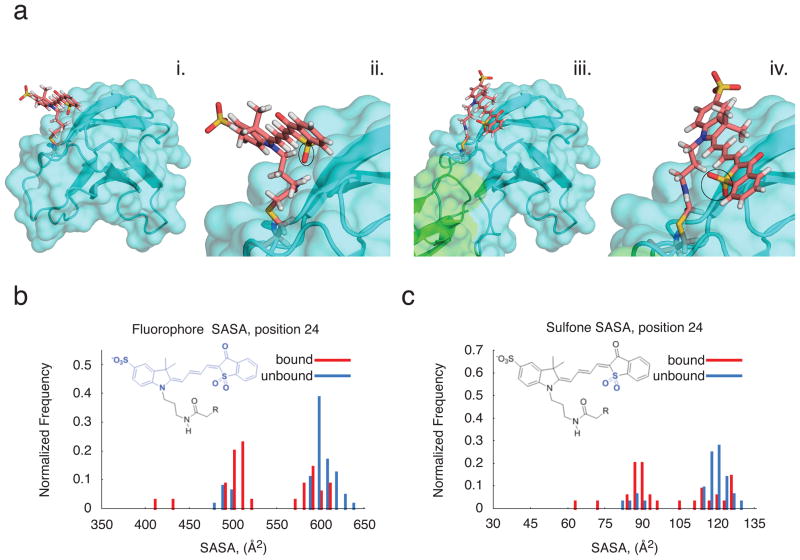
Fluorescent biosensors for living cells currently require laborious optimization and a unique design for each target. They are limited by the availability of naturally occurring ligands with appropriate target specificity. Here we describe a biosensor based on an engineered fibronectin monobody scaffold that can be tailored to bind different targets via high-throughput screening. We made this Src-family kinase (SFK) biosensor by derivatizing a monobody specific for activated SFKs with a bright dye whose fluorescence increases upon target binding. We identified sites for dye attachment and changes to eliminate vesiculation in living cells, providing a generalizable scaffold for biosensor production. This approach minimizes cell perturbation because it senses endogenous, unmodified target, and because sensitivity is enhanced by direct dye excitation. Automated correlation of cell velocities and SFK activity revealed that SFKs are activated specifically during protrusion. Activity correlates with velocity, and peaks 1-2 μm from the leading edge.


Conflict of interest statement

Competing financial interests. The authors declare no competing financial interests.

Figures

Figure 1
Figure 1. Screening a fibronectin monobody library leads to a biosensor for Src family activity
a) A library of fibronectin monobodies is screened to find a library member with the appropriate binding selectivity and affinity for the targeted protein state. The library is based on a uniform scaffold stable in living cells and suitable for conversion to biosensors. The appropriate library member is fused to a fluorescent protein (FP) via a flexible linker and further derivatized with an environmentally sensitive dye to report target binding. b) The present biosensor is based on a binder that is specific for the activated conformation of Src family kinases (SFK). Biosensor binding to active SFK leads to increased fluorescence from the merocyanine dye. The ratio of dye fluorescence/protein fluorescence provides a quantitative measure of SFK activation kinetics and localization in living cells.
Figure 2
Figure 2. Fibronectin monobody 1F11 preferentially binds active Src
a) 1F11 monobody binding to Src in lysates from cells +/− the Src activator Ciglitazone. GN4 cells were either untreated, treated with vehicle DMSO, vehicle plus pervanadate pretreatment (P), 50 μM Ciglitazone (Cig), or Ciglitazone with pervanadate pretreatment. Immunoblot was used to assay pulldown of Src by beads alone (B), the 1F11 monobody (1F11), control nonbinding monobody (wt FN3), GFP-1F11 with sub-optimal linker (G1F) or GFP-FN3 sub-optimal linker (GFN). b) Src kinase activity bound to the monobody or controls as in (a). Data shown is an average of three independent experiments.
Figure 3
Figure 3. Screening for responsive sensor variants – selecting dye and site for dye labeling
a) Structures of the environmentally sensitive merocyanine dyes tested on the monobody. b) Ribbon representation of the active state binder 1F11 (based on published FN3 domain crystal structure PDB: 1NFNA). Residues 2, 24, 52, 53, and 55 where cysteine was incorporated for dye attachment and testing are shown as space-filling side chains. The alanine shown in bold marks the position of dye attachment in the final merobody biosensor. The putative target binding loops are shown in cyan. c) Ratiometric fluorescence response (dye emission/m-Cerulean emission) of the various combinations of mero dyes and residues labeled. d) Titration showing the change in normalized emission ratio Mero-53/m-Cerulean for the biosensor or control (0.5 μM) with increasing c-Src SH3. The control sensor has a P80A mutation in the FG binding loop of 1F11.
Figure 4
Figure 4. Src activation dynamics in living cells
a) DIC (left panel) and ratio images (right panel) of a PDGF-stimulated NIH 3T3 MEF microinjected with the SFK merobody biosensor. Scale baris 20 μm. Note prominent circular dorsal ruffles b) Ratio image of a PTK1 cell microinjected with the biosensor. Scale bar is 20μm. c) DIC (left panels), m-Cerulean (merobody localization, middle panels), and ratio images (right panels) from representative frames of a movie in which a PTK1 cell microinjected with the biosensor was treated with the Src inhibitor PP2. Scale bar is 10 μm.
Figure 5
Figure 5. Automated edge analysis and line scans reveals distinct zone of SFK activity that is correlated with protrusion velocity
a) SFK activity as a function of microns from the cell edge. SFK activity is localized towards the edge of the cell and is inhibited by PP2 Treatment. For all data points the standard error is less than 0.1%. At 1μm, the difference between the mean normalized intensity ratio, before and after PP2 treatment, is ~0.08 and is statistically significant (p<0.001). b) SFK activity as a function of distance from the cell edge and velocity. SFK activity is approximately proportional to protrusion speed. The vertical plane is at velocity = 0. The standard error, for a given velocity and distance, is less than 0.3%. c, d) Response of the merobody biosensor (c) compared to the non-binding control (d). The merobody biosensor reports both higher activity than the non-binding control, and a stronger dependence on velocity.The standarderror for for a given velocity and distance is less than 0.3% (c) and less than 1% (d).
Figure 6
Figure 6. Modeling of the 1F11-dye/SH3 interface
a) Computermodels of either unbound 1F11-mero53 conjugate alone (i and ii) or in complex with cSrc-SH3 (iii and iv). Dye is attached to residue 24 as in the final ‘merobody’ biosensor. c-Src SH3 is green, 1F11 is blue, and dye is salmon. In ii,iv (magnified versions), the sulphone group of the dye is highlighted (closed circles). The model of unbound biosensor is part of the sub-population in which the dye has higher solvent accessible surface area (SASA). The model of bound biosensor shown here is the highest-scoring model and member of the low-SASA cluster. b,c) SASA distribution for the top 0.5% of models for the bound and unbound states, either for whole fluorophore (b) or the sulphone group (c).

References

    1. Nalbant P, Hodgson L, Kraynov V, Toutchkine A, Hahn KM. Activation of endogenous Cdc42 visualized in living cells. Science. 2004;305:1615–9. - PubMed
    1. Toutchkine A, Kraynov V, Hahn K. Solvent-sensitive dyes to report protein conformational changes in living cells. J Am Chem Soc. 2003;125:4132–45. - PubMed
    1. Toutchkine A, Nguyen DV, Hahn KM. Merocyanine dyes with improved photostability. Org Lett. 2007;9:2775–7. - PubMed
    1. Toutchkine A, Nguyen DV, Hahn KM. Simple one-pot preparation of water-soluble, cysteine-reactive cyanine and merocyanine dyes for biological imaging. Bioconjug Chem. 2007;18:1344–8. - PMC - PubMed
    1. Koide A, Bailey CW, Huang X, Koide S. The fibronectin type III domain as a scaffold for novel binding proteins. J Mol Biol. 1998;284:1141–51. - PubMed

Publication types