. 2011 Jun 12;12(7):616-23.
doi: 10.1038/ni.2051.

A semi-invariant Vα10+ T cell antigen receptor defines a population of natural killer T cells with distinct glycolipid antigen-recognition properties

Affiliations

A semi-invariant Vα10+ T cell antigen receptor defines a population of natural killer T cells with distinct glycolipid antigen-recognition properties

Adam P Uldrich et al. Nat Immunol. .

Abstract

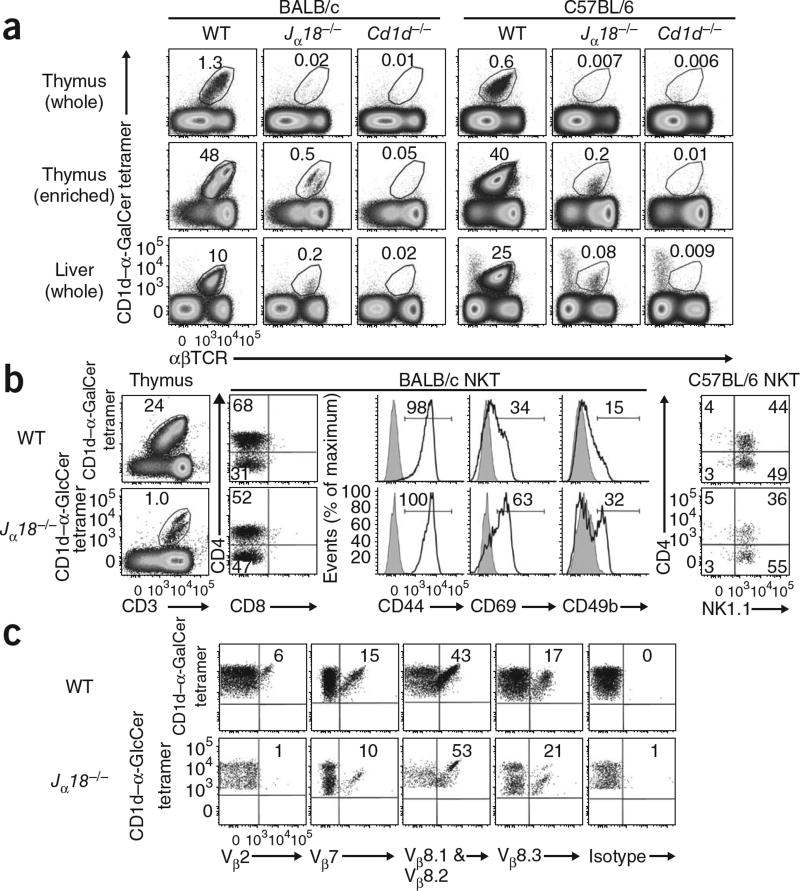
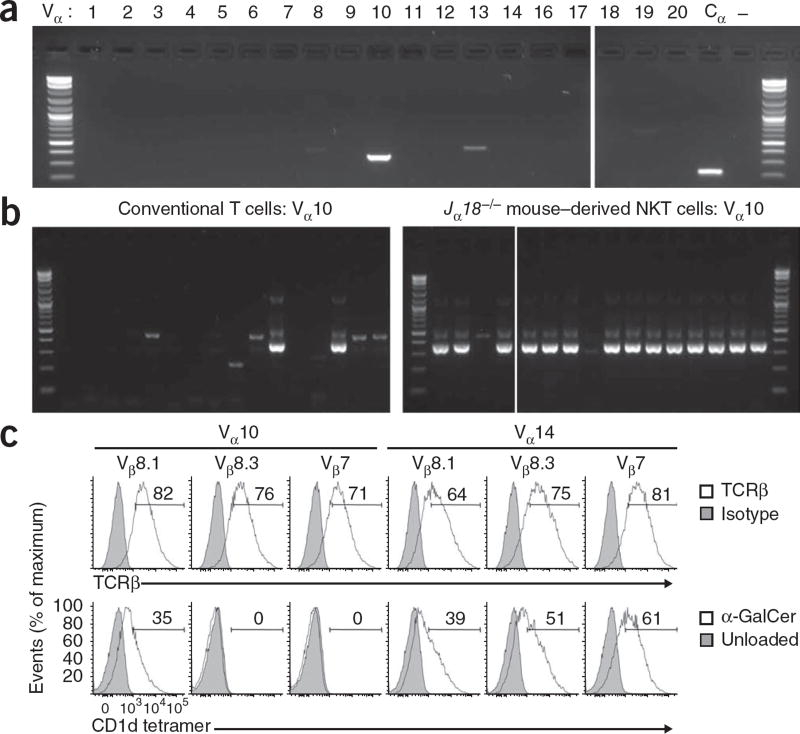
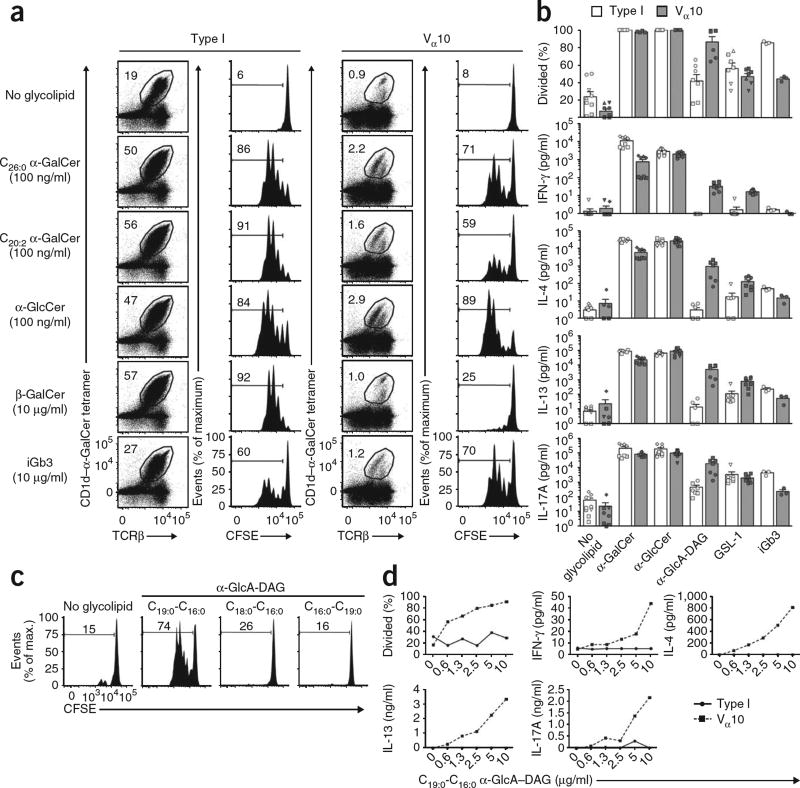
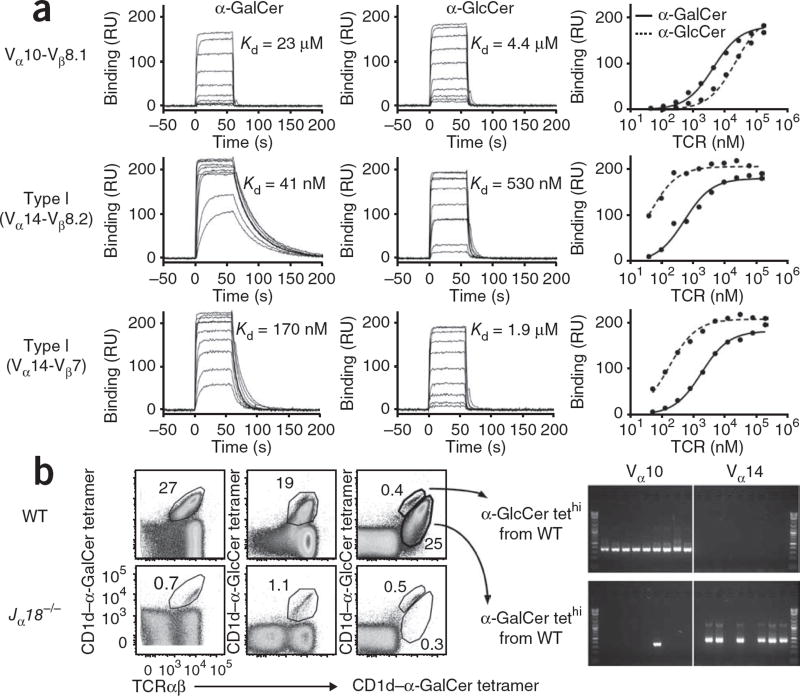
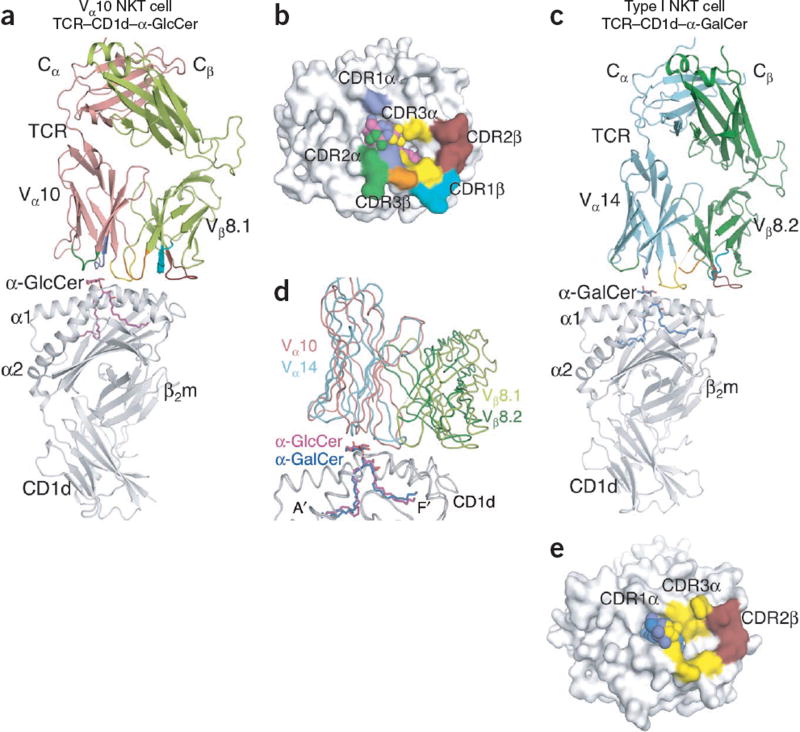
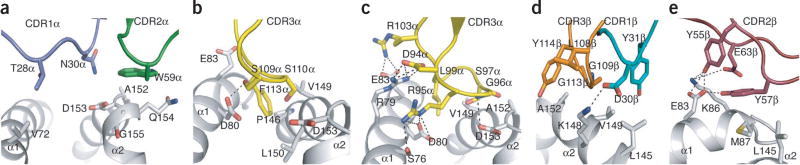
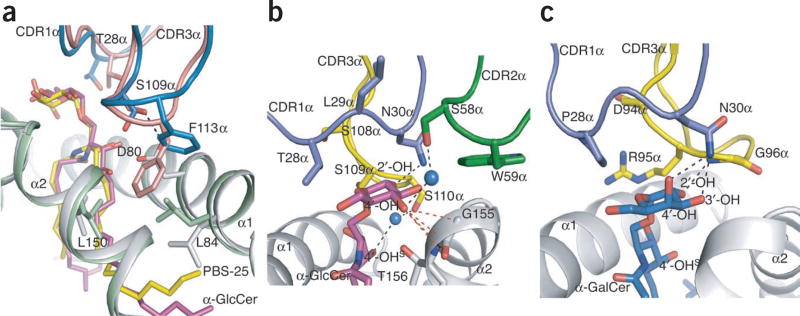
Type I natural killer T cells (NKT cells) are characterized by an invariant variable region 14-joining region 18 (V(α)14-J(α)18) T cell antigen receptor (TCR) α-chain and recognition of the glycolipid α-galactosylceramide (α-GalCer) restricted to the antigen-presenting molecule CD1d. Here we describe a population of α-GalCer-reactive NKT cells that expressed a canonical V(α)10-J(α)50 TCR α-chain, which showed a preference for α-glucosylceramide (α-GlcCer) and bacterial α-glucuronic acid-containing glycolipid antigens. Structurally, despite very limited TCRα sequence identity, the V(α)10 TCR-CD1d-α-GlcCer complex had a docking mode similar to that of type I TCR-CD1d-α-GalCer complexes, although differences at the antigen-binding interface accounted for the altered antigen specificity. Our findings provide new insight into the structural basis and evolution of glycolipid antigen recognition and have notable implications for the scope and immunological role of glycolipid-specific T cell responses.


Figures

Figure 1
Figure 1
Identification of Jα18−/− T cells reactive to CD1d–α-GalCer. (a) Flow cytometry of thymocytes and liver lymphocytes isolated from BALB/c and C57BL/6 wild-type (WT), Jα18−/− and Cd1d−/− mice (n = 7–9 mice per genotype) and stained with tetramer loaded with CD1d–α-GalCer and monoclonal antibody to αβTCR; thymocyte populations were also enriched for NKT cells by complement-mediated depletion of CD24+ and CD8+ thymocytes. Numbers above outlined areas indicate percent tetramer-positive αβTCR+ cells. (b) Expression of CD4 versus CD3, CD8, CD44, CD69 and CD49b (black lines) and isotype-matched control antibody staining (gray shading) on NKT cells reactive to CD1d–α-GalCer (BALB/c wild-type cells) or CD1d–α-GlcCer (BALB/c Jα18−/− cells); right, expression of CD4 and NK1.1 in NKT cells from mice on the C57BL/6 background. Numbers above outlined areas, in quadrants or above bracketed lines, indicate percent positive cells in each area. (c) Expression of various TCRβ Vβ regions by NKT cells from BALB/c wild-type and Jα18−/− mice. Numbers in quadrants indicate percent positive cells in each. Data are representative of three (a) or two (b,c) separate experiments.
Figure 2
Figure 2
Jα18−/− CD1d–α-GalCer+ NKT cells express a semi-invariant Vα10-Jα50–Vβ8+ TCR. (a) PCR analysis of cDNA isolated from CD1d–α-GalCer-reactive cells sorted from BALB/c Jα18−/− thymuses and amplified with a panel of primers specific for each TCRα V-gene segment or the α-chain constant region (Cα). – (far right), Cα primers with no cDNA. (b) Single-cell PCR analysis for Vα10 on cDNA isolated from Vβ8.1 and Vβ8.2+ cells positive for CD1d–α-GalCer tetramer (right; Jα18−/− mouse–derived) or Vβ8.1 and Vβ8.2+ CD4+ αβTCR+ cells negative for the CD1d–α-GalCer tetramer (left; conventional T cells) sorted from BALB/c Jα18−/− thymuses; n = 16 cells per panel. (c) Staining of surface TCRβ (top row) and unloaded or α-GalCer-loaded CD1d tetramer (bottom row) on green fluorescent protein–gated human epithelial 293T cells transfected to express full-length rearranged Vα10-Jα50 or Vα14-Jα18 TCR α-chain, plus Vβ8.1, Vβ8.3 or Vβ7 TCR β-chain, and CD3 complex. Isotype, isotype-matched control antibody. Numbers above bracketed lines indicate percent-positive cells. Data are from one experiment (a,b; one for each) or are representative of one (Vβ8.1) or two (Vβ8.3 and Vβ7) experiments (c).
Figure 3
Figure 3
Vα10 NKT cells have a unique hierarchy of antigen recognition. (a) Frequency of NKT cells among thymocyte populations obtained from BALB/c wild-type and Jα18−/− mice, depleted of CD8+ and CD24+ cells and cultured for 72 h with glycolipid-pulsed antigen-presenting cells (Jα18−/− splenocytes), and proliferation of CFSE-labeled type I and Vα10 NKT cells (gated on CD1d–α-GalCer tetramer, with an additional gate to exclude CFSE spectral overlap (not shown)). Numbers above outlined areas or brackets indicate percent positive cells in each; numbers above bracketed lines indicate percent divided cells. Data are from one of two similar experiments. (b) Proliferation (top) and cytokines in supernatants (below) of NKT cells positive for the CD1d–α-GalCer tetramer sorted from BALB/c wild-type and Jα18−/− mice, then labeled with CFSE and cultured for 72 h (4 × 10³ cells per well) in the presence of no glycolipid, α-GalCer (C26:0; 500 ng/ml), α-GlcCer (C20:2; 500 ng/ml), α-GlcA–DAG(mixture of variants; 10 µg/ml), GSL-1 (1 µg/ml) or iGb3 (10 µg/ml), plus 20 × 103 sorted splenic CD11c+ dendritic cells. Each symbol shape represents a different experiment. IFN-γ, interferon-γ. Data are from up to four independent experiments (mean and s.e.m. of three to twelve replicates). (c) Proliferation of gated Vα10 NKT cells positive for the CD1d–α-GalCer tetramer, sorted from BALB/c Jα18−/− thymus, labeled with CFSE and cultured for 72 h in the presence (1 × 10³ cells per well) or absence (5 × 10³ cells per well) of α-GlcA-DAG (10 µg/ml), plus sorted CD11c+ dendritic cells (20 × 103 per well). Numbers above bracketed lines indicate percent divided cells. Data are from one experiment with two replicates. (d) Proliferation and cytokine concentrations in supernatants of NKT cells positive for the CD1d–α-GalCer tetramer, sorted from BALB/c wild-type thymus (type I) or Jα18−/− thymus (Vα10), labeled with CFSE and cultured for 72 h (2 × 10³ cells per well) with 20 × 103 sorted CD11c+ dendritic cells and doubling dilutions of C19:0-C16:0 α-GlcA-DAG. Data are from one of two similar experiments (mean of duplicate cultures).
Figure 4
Figure 4
Vα10 NKT cells have a higher affinity for α-GlcCer and are present in wild-type mice. (a) Binding of graded concentrations of Vα10 soluble TCR (Vα10–Vβ8.1 (175–0.05 µM)) or type I soluble TCR (Vα14–Vβ8.2 (150–0.04 µM) or Vα14–Vβ7 (200–0.05 µM)) to CD1d–α-GalCer or CD1d–α-GlcCer, after subtraction of results from those of a control flow cell (unloaded CD1d). Far right, saturation plots showing equilibrium binding to immobilized CD1d–α-GalCer or CD1d–α-GlcCer and the equilibrium dissociation constant (Kd) derived by equilibrium analysis. RU, response units. Data are representative of two independent experiments. (b) Staining profiles of α-GalCer tetramer (left) and α-GlcCer tetramer (middle) and dual tetramer labeling (right) in BALB/c wild-type or Jα18−/− thymocyte populations depleted of CD8+ and CD24+ cells, then simultaneously costained with CD1d tetramers loaded with α-GalCer and α-GlcCer. Numbers adjacent to outlined areas indicate percent cells in each. Far right, single-cell PCR analysis of Vα10 and Vα14 on wild-type NKT cells with high expression of the α-GlcCer tetramer (α-GlcCer tethi) or α-GalCer tetramer (α-GalCer tethi). Data are representative of three independent experiments.
Figure 5
Figure 5
Structural comparison of Vα10 NKT cell TCR–CD1d–α-GlcCer and type I NKT cell TCR–CD1d–α-GalCer. (a) NKT cell Vα10–Vβ8.1 TCR in complex with CD1d–α-GlcCer: magenta, α-GlcCer; gray, CD1d; salmon, Vα10; light green, Vβ8.1; purple, CDR1α; dark green, CDR2α; yellow, CDR3α; teal, CDR1β; ruby, CDR2β; orange, CDR3β. β2m, β2-microglobulin. (b) Footprint of the NKT cell Vα10–Vβ8.1 TCR on the surface of CD1d–α-GlcCer: spheres indicate α-GlcCer; colors of CD1d and CDR loops as in a. (c) Type I NKT cell Vα14–Vβ8.2 TCR in complex with CD1d–α-GalCer: blue, α-GalCer; cyan, Vα14; dark green, Vβ8.2; colors of CD1d and CDR loops as in a. (d) Superposition of NKT cell Vα10–Vβ8.1 TCR–CD1d–α-GlcCer and type I NKT cell Vα14–Vβ8.2 TCR–CD1d–α-GalCer (colors as in a,c). (e) Footprint of the type I NKT cell Vα14–Vβ8.2 TCR on the surface of CD1d–α-GalCer: spheres indicate α-GalCer; colors of CD1d, α-GalCer and CDR loops as in a,c.
Figure 6
Figure 6
CD1d-mediated interactions with Vα10–Vβ8.1 NKT cell TCR. (a) Contacts of Vα10 NKT cell TCR CDR1α and CDR2α with CD1d. (b) Contacts of Vα10 NKT cell TCR CDR3α with CD1d. (c) Contacts of type I NKT cell TCR CDR3α with CD1d. (d) Contacts of Vα10 NKT cell TCR CDR1β and CDR3β with CD1d. (e) Contacts of Vα10 NKT cell TCR CDR2β with CD1d. Purple, CDR1α; dark green, CDR2α; yellow, CDR3α; teal, CDR1β; ruby, CDR2β; orange, CDR3β; gray, CD1d; black dashed lines, hydrogen bonds and salt-bridge interactions.
Figure 7
Figure 7
Lipid antigen specificity. (a) Overlay of Vα10 TCR not bound to a ligand and the binary complex of CD1d–PBS-25 (Protein Data Bank accession code, 1Z5L) on the Vα10 TCR–CD1d–α-GlcCer ternary complex: gray, CD1d in the Vα10 complex; magenta, α-GlcCer; salmon, Vα10 TCR in complex; blue, Vα10 TCR not bound to a ligand; light green, CD1d in binary complex; yellow, PBS-25 (α-GalCer analog with a shorter acyl chain). (b) Interactions with the Vα10 NKT cell TCR mediated by α-GlcCer: purple, CDR1α; dark green, CDR2α; yellow, CDR3α; magenta, α-GlcCer; gray, CD1d; blue, H2O molecules; −OHS, −OH on the sphingosine chain. (c) Interactions with the type I NKT cell TCR mediated by α-GalCer: blue, α-GalCer; colors of CD1d and CDR loops as in b. Black dashed lines, hydrogen bonds; red dashed lines, van der Waals interactions.

References

    1. Godfrey DI, MacDonald HR, Kronenberg M, Smyth MJ, Van Kaer L. NKT cells: what’s in a name? Nat. Rev. Immunol. 2004;4:231–237. - PubMed
    1. Cardell S, et al. CD1-restricted CD4+ T cells in major histocompatibility complex class II-deficient mice. J. Exp. Med. 1995;182:993–1004. - PMC - PubMed
    1. Park SH, et al. The mouse CD1d-restricted repertoire is dominated by a few autoreactive T cell receptor families. J. Exp. Med. 2001;193:893–904. - PMC - PubMed
    1. Blomqvist M, et al. Multiple tissue-specific isoforms of sulfatide activate CD1d-restricted type II NKT cells. Eur. J. Immunol. 2009;39:1726–1735. - PMC - PubMed
    1. Cui JQ, et al. Requirement for Vα14 NKT cells in Il-12-mediated rejection of tumors. Science. 1997;278:1623–1626. - PubMed

Publication types