. 2011 Jun;9(6):e1001075.
doi: 10.1371/journal.pbio.1001075. Epub 2011 Jun 7.

Patterns and mechanisms of ancestral histone protein inheritance in budding yeast

Affiliations

Patterns and mechanisms of ancestral histone protein inheritance in budding yeast

Marta Radman-Livaja et al. PLoS Biol. 2011 Jun.

Abstract

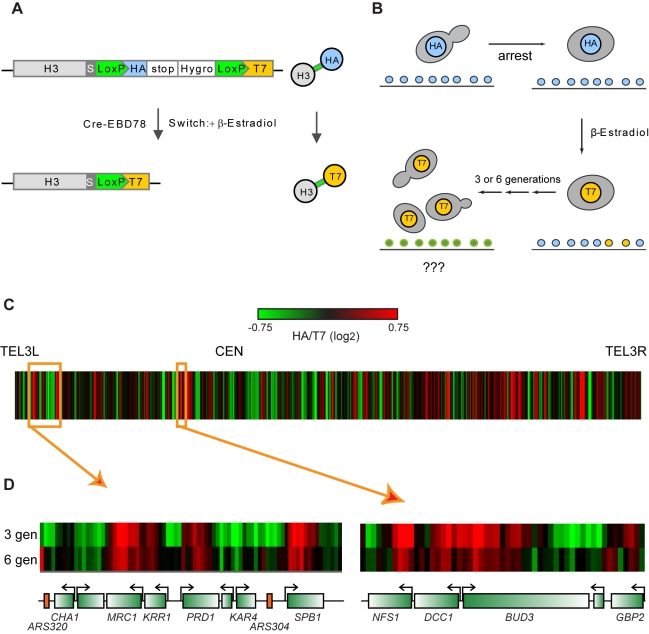
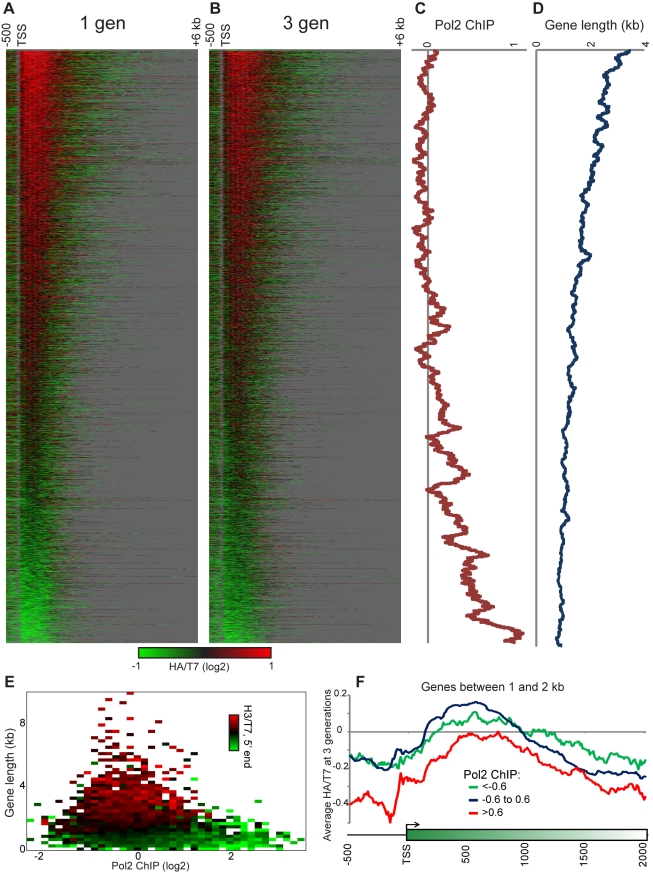
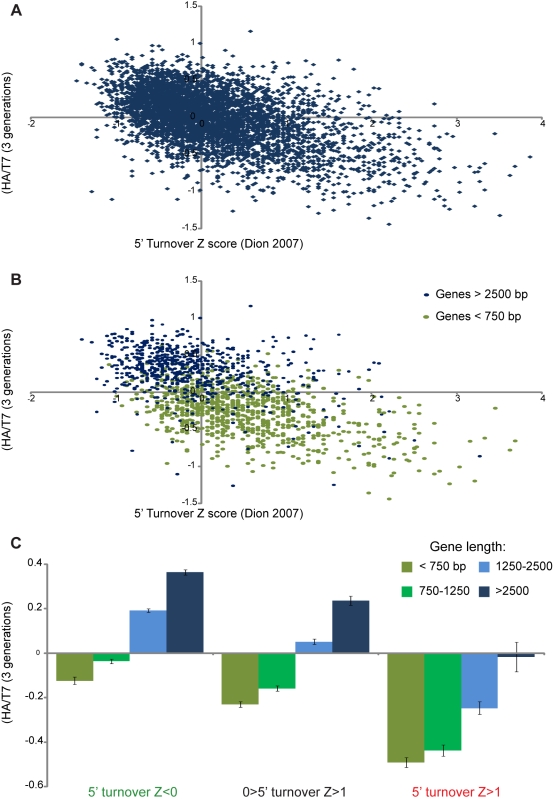
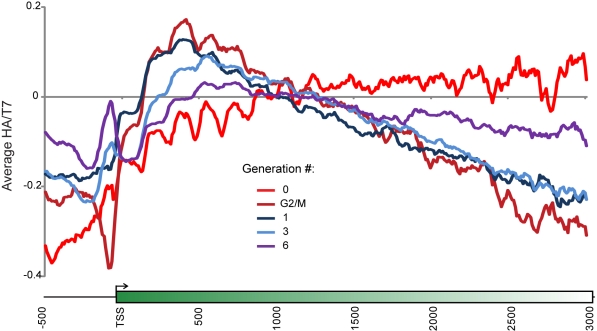
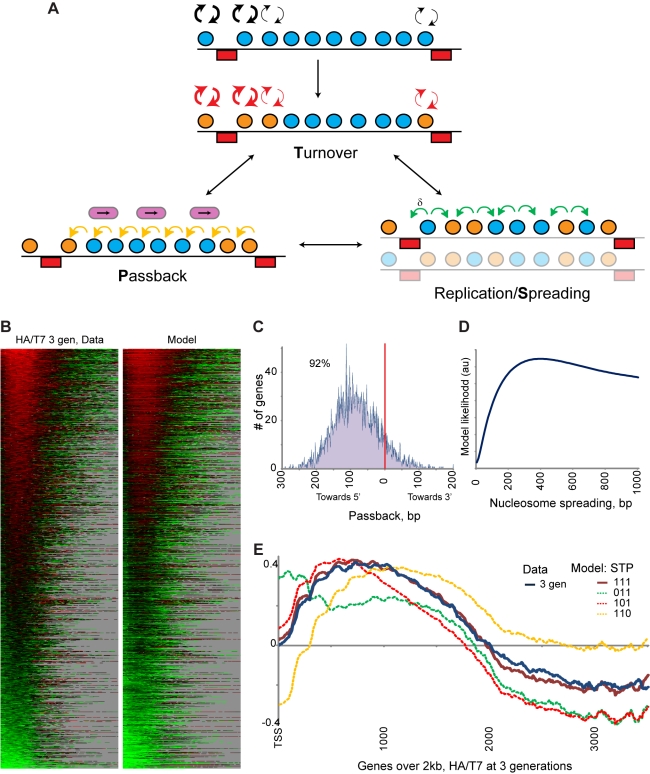
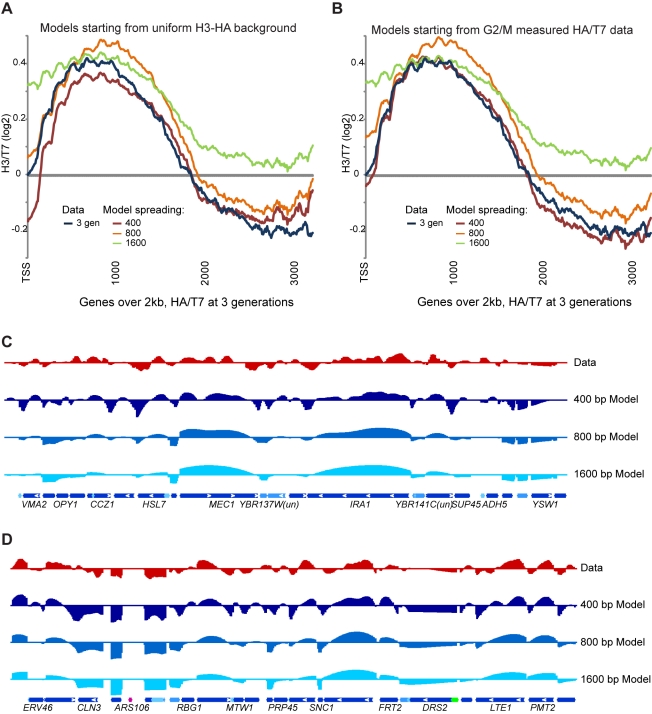
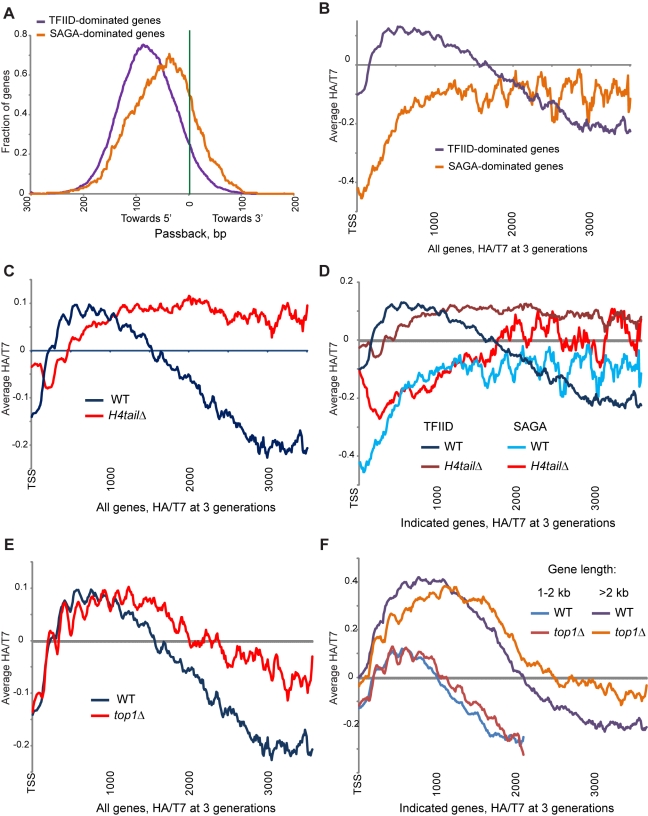
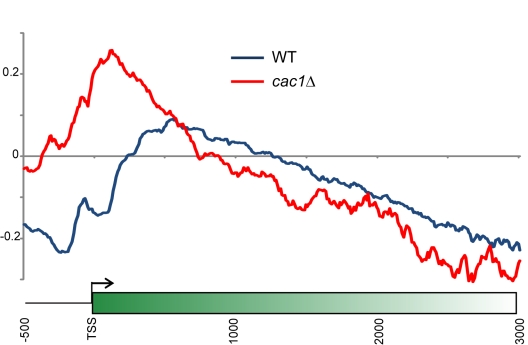
Replicating chromatin involves disruption of histone-DNA contacts and subsequent reassembly of maternal histones on the new daughter genomes. In bulk, maternal histones are randomly segregated to the two daughters, but little is known about the fine details of this process: do maternal histones re-assemble at preferred locations or close to their original loci? Here, we use a recently developed method for swapping epitope tags to measure the disposition of ancestral histone H3 across the yeast genome over six generations. We find that ancestral H3 is preferentially retained at the 5' ends of most genes, with strongest retention at long, poorly transcribed genes. We recapitulate these observations with a quantitative model in which the majority of maternal histones are reincorporated within 400 bp of their pre-replication locus during replication, with replication-independent replacement and transcription-related retrograde nucleosome movement shaping the resulting distributions of ancestral histones. We find a key role for Topoisomerase I in retrograde histone movement during transcription, and we find that loss of Chromatin Assembly Factor-1 affects replication-independent turnover. Together, these results show that specific loci are enriched for histone proteins first synthesized several generations beforehand, and that maternal histones re-associate close to their original locations on daughter genomes after replication. Our findings further suggest that accumulation of ancestral histones could play a role in shaping histone modification patterns.


Conflict of interest statement

The authors have declared that no competing interests exist.

Figures

Figure 1
Figure 1. Overview of system for tracking ancestral histone proteins.
(A) Recombination-based swapping of epitope tags on histone H3. Histone H3 is tagged at its endogenous locus with a C-terminal HA epitope tag surrounded by LoxP sites. Upon induction of Cre recombinase with β-estradiol, the HA tag is recombined out and H3 is left with a C-terminal T7 tag. (B) Experimental overview. Yeast carrying HA-tagged H3 are arrested by nutrient depletion, and the HA→T7 swap is induced by overnight incubation with β-estradiol. After the tag swap, yeast are released from arrest and HA and T7 tags are mapped across the genome at varying times post-release. (C) Chromosome III overview. HA/T7 ratios are shown as a heatmap across chromosome III at 3 generations after release. Notable in this view is a lack of accumulation of H3-HA at TEL3L or the silent mating loci. (D) Close-up views of two genomic loci. Data are shown as a heatmap for 3 and 6 generations after the tag swap.
Figure 2
Figure 2. Ancestral H3 molecules accumulate at the 5′ ends of long, poorly transcribed genes.
(A–B) Heatmap of sites of ancestral H3 accumulation. Genes are aligned by TSS (indicated), and Log2 HA/T7 ratios are indicated as a heatmap. Genes are ordered by the median HA/T7 ratio over the 5′-most 1 kb at 3 generations. Grey over coding regions indicates missing data; grey downstream of genes indicates sequence downstream of the 3′ end of the gene to show gene length. Accumulation of ancestral histones at the 5′ ends of genes peaks around the +3 nucleosome, as expected given that the +1 and +2 nucleosomes are generally subject to high rates of replication-independent H3/H4 replacement ,. (C) An 80 gene sliding window average of Pol2 ChIP levels for genes ordered as in (A–B), showing that genes with low levels of ancestral H3 retention are highly transcribed. (D) 80 gene sliding window average of gene lengths, showing that genes with high levels of ancestral H3 retention tend to be long. (E) The median HA/T7 ratio over the 5′ end of genes (1 kb) was calculated for all genes, and median values of this retention metric are shown for groups of genes ordered by transcription rate (x-axis) and gene length (y-axis). While these are not independent—highly expressed genes tend to be short—for a given gene length genes transcribed at higher levels exhibit low HA retention levels. This is true mostly of genes shorter than 3 kb, which encompasses the majority of yeast genes. (F) Average HA/T7 ratios (Log2) for genes between 1 and 2 kb, broken into high (red), low (green), and intermediate (blue) transcription rates.
Figure 3
Figure 3. H3 retention anticorrelates with replication-independent turnover in a gene length-dependent manner.
(A) Scatterplot of ancestral H3 retention (median Log2 HA/T7 for the 5′ 1 kb, y-axis) versus replication-independent turnover (Dion et al. , Z score, x-axis). (B) HA retention is plotted against 5′ H3 turnover as above but with short and long genes plotted separately. For a given level of H3 turnover, ancestral retention is greater at longer genes. (C) Averages of the 5′ HA/T7 retention parameter (median HA/T7 for the 5′-most 1 kb) are shown for genes broken into different length and 5′ turnover groups. For all turnover levels, longer genes retain more H3-HA than do shorter genes.
Figure 4
Figure 4. Kinetic analysis of ancestral H3 retention.
HA/T7 ratios were measured genome-wide after recombination but before release (Gen 0), after release into nocodazole (G2/M), and after 1, 3, or 6 generations of growth post-release. Data for all genes were averaged and are plotted as indicated.
Figure 5
Figure 5. Quantitative modeling reveals three distinct dynamic processes.
(A) Outline of quantitative model. From a given starting distribution, histones are subject to turnover , transcription-associated lateral movement (“passback”), and replication-mediated spreading. Model is described in detail in Text S1. (B) The model captures major features of the experimental data. HA/T7 ratios for experimental data and model predictions are shown for all genes as a heatmap. (C) Distribution of lateral passback parameter (per generation) for all genes. Note that the vast majority (92%) of genes were associated with retrograde 3′ to 5′ movement along coding regions. (D) Estimation of replication-based spreading of maternal histones. Model likelihood (Text S1) is plotted on the y-axis for various width spreading distributions (defined as 1 standard deviation of the Gaussian describing histone movement at replication—see Text S1 for model details). (E) Eliminating any of the three model features worsens fit to data. Plotted are averages at 3 generations for genes over 2 kb for data versus predictions of various models (“STP” refer to replication-mediated Spreading, replication-independent Turnover, and Passback). Note that the model eliminating turnover underestimates turnover effects, as histones that spread or are passed over the 5′ end of the gene are still eliminated in this model (i.e., in this model we effectively only eliminate turnover within CDS, not in intergenic regions), providing another basis for high loss of 5′ histones.
Figure 6
Figure 6. Dependency of histone dynamics model on spreading parameter.
(A–B) Parameters in the quantitative model described in Figure 5 were re-optimized after fixing the spreading term to 400 bp (as in Figure 5), 800, or 1,600 bp. Data and simulations are shown averaged for genes over 2 kb for models starting with a uniform H3-HA distribution (A) or starting with the experimentally measured G2/M HA/T7 distribution (B). (C–D) Examples of data and three models with different spreading parameters. Genomic coordinates are chromosome 2 490–540 kb (C), and chromosome 1 60–110 kb (D). Y-axis shows measured (Data) or predicted HA/T7 values, in Log2.
Figure 7
Figure 7. Mutants affecting ancestral histone retention.
(A) Distribution of lateral nucleosome distances from model (Figure 5). Shown are the passback parameters for SAGA-dominated and TFIID-dominated genes as defined in Huisinga et al. . (B) TFIID-dominated genes preferentially accumulate 5′ H3-HA. Averages of 3 generation experimental data are shown for the indicated gene classes. (C) H4 tail deletion dramatically reshapes the landscape of ancestral histone retention. Yeast carrying an N-terminal H4 tail deletion were processed as in Figure 1A–B, and averages for all genes are plotted as indicated. We note that this strain has retained a wild-type HHT2-HHF2 locus for viability, so results must be interpreted with caution. However, we find similar but less dramatic effects in an H4K5,12R mutant (Figure S8B), supporting the observation here that passback is affected by the H4 N-terminal tail. (D) H4 tail deletion preferentially affects TFIID-dominated genes. Data for wild-type and H4tailΔ yeast are plotted for the indicated gene classes. (E) Topoisomerase I plays a role in 5′ accumulation of ancestral histones. top1Δ yeast were processed as in Figure 1A–B, and averages for all genes are plotted as indicated. (F) TOP1 deletion affects 5′ passback preferentially at long genes. Data for wild-type and top1Δ yeast are plotted for the indicated gene classes.
Figure 8
Figure 8. Effects of Chromatin Assembly Factor-1 complex on ancestral H3 patterns.
Yeast lacking CAF-1 subunit Cac1 were processed as in Figure 1A, and HA/T7 ratio averages are shown for all genes in wild-type and cac1Δ mutants 3 generations after release.
Figure 9
Figure 9. Ancestral H3 retention and histone modification patterns.
(A) Scatterplot of previously measured H3K79me3 levels averaged over the 5′ CDS of genes versus the median HA/T7 for the 5′ 1 kb of each gene. (B) As in (A), for K79me3 averaged over mid-CDS of each gene.

Comment in

References

    1. Ptashne M. On the use of the word ‘epigenetic’. Curr Biol. 2007;17:R233–R236. - PubMed
    1. Ringrose L, Paro R. Epigenetic regulation of cellular memory by the Polycomb and Trithorax group proteins. Annu Rev Genet. 2004;38:413–443. - PubMed
    1. Rusche L. N, Kirchmaier A. L, Rine J. The establishment, inheritance, and function of silenced chromatin in Saccharomyces cerevisiae. Annu Rev Biochem. 2003;72:481–516. - PubMed
    1. Annunziato A. T. Split decision: what happens to nucleosomes during DNA replication? J Biol Chem. 2005;280:12065–12068. - PubMed
    1. Groth A. Replicating chromatin: a tale of histones. Biochem Cell Biol. 2009;87:51–63. - PubMed

Publication types