

Neural Correlates of Individual Differences in Infant Visual Attention and Recognition Memory
- PMID: 21666833
- PMCID: PMC3110012
- DOI: 10.1111/j.1532-7078.2010.00060.x
Neural Correlates of Individual Differences in Infant Visual Attention and Recognition Memory
Abstract
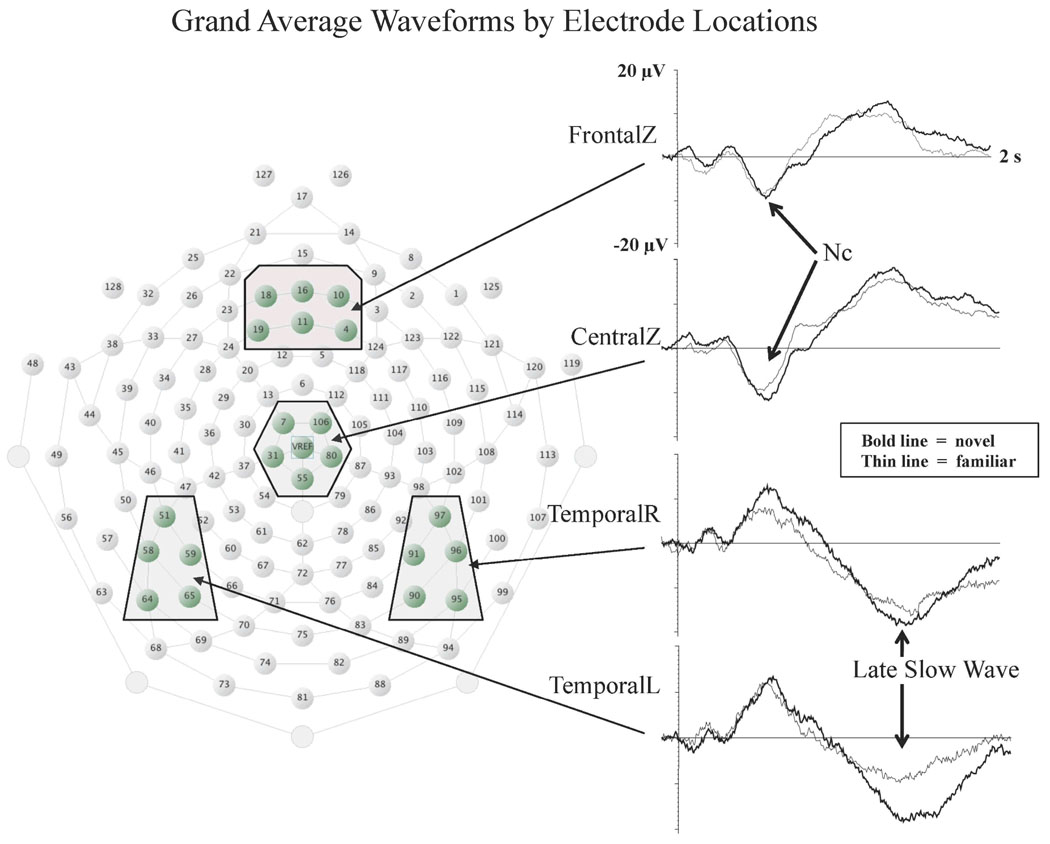
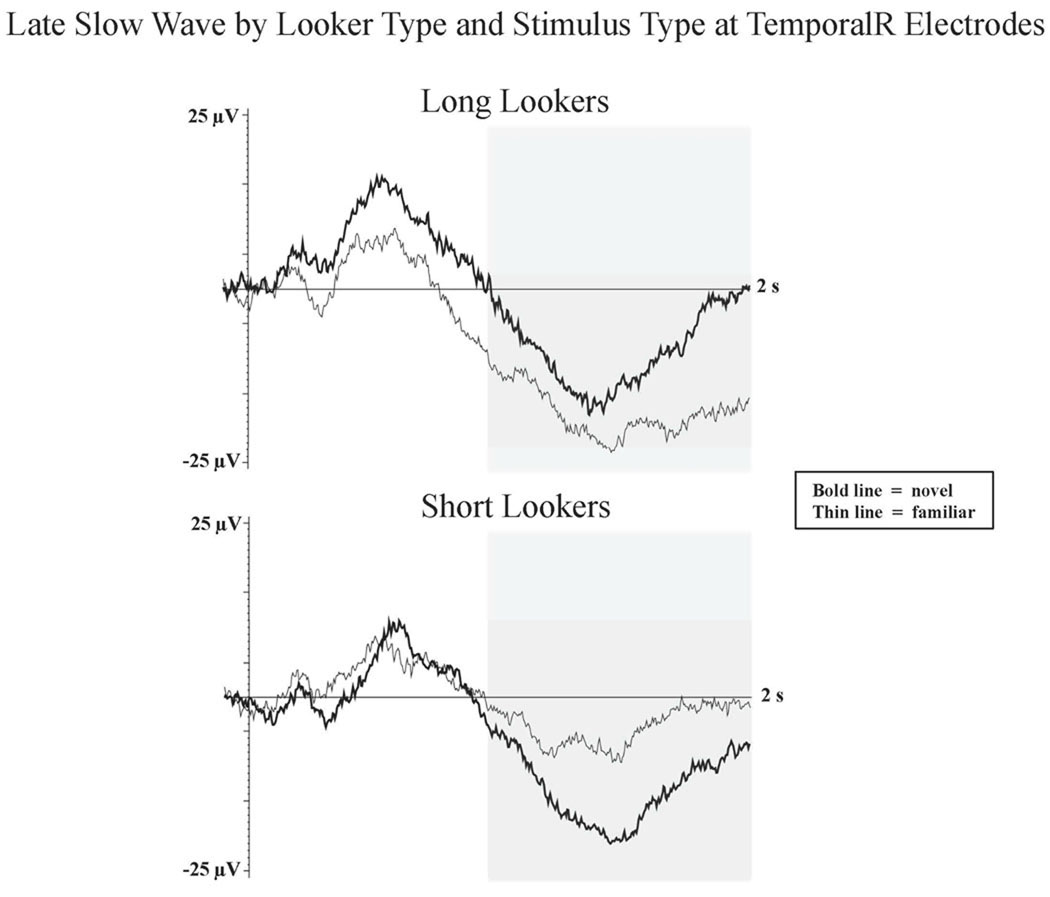
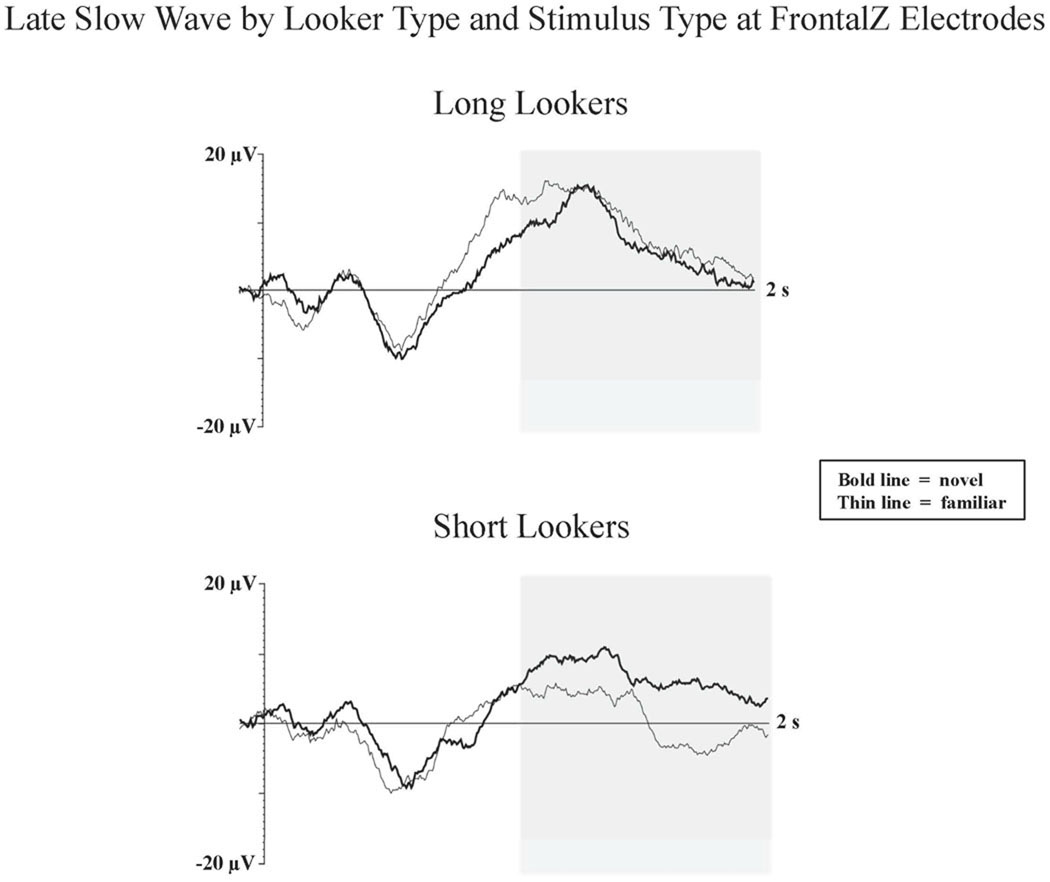
Past studies have identified individual differences in infant visual attention based upon peak look duration during initial exposure to a stimulus. Colombo and colleagues (e.g., Colombo & Mitchell, 1990) found that infants that demonstrate brief visual fixations (i.e., short lookers) during familiarization are more likely to demonstrate evidence of recognition memory during subsequent stimulus exposure than infants that demonstrate long visual fixations (i.e., long lookers). The current study utilized event-related potentials to examine possible neural mechanisms associated with individual differences in visual attention and recognition memory for 6- and 7.5-month-old infants. Short- and long-looking infants viewed images of familiar and novel objects during ERP testing. There was a stimulus type by looker type interaction at temporal and frontal electrodes on the late slow wave (LSW). Short lookers demonstrated a LSW that was significantly greater in amplitude in response to novel stimulus presentations. No significant differences in LSW amplitude were found based on stimulus type for long lookers. These results indicate deeper processing and recognition memory of the familiar stimulus for short lookers.
Figures
References
-
- Bornstein MH, Sigman MD. Continuity in mental development from infancy. Child Development. 1986;57:81–99. - PubMed
-
- Colombo J. Infant cognition: Predicting later intellectual functioning. Newbury Park, CA: Sage Publications; 1993.
-
- Colombo J. On the neural mechanisms underlying developmental and individual differences in visual fixation in infancy: Two hypotheses. Developmental Review. 1995;15:97–135.
-
- Colombo J, Fagen JW, editors. Individual differences in infancy: Reliability, stability, and prediction. Hillsdale, NJ: Lawrence Erlbaum and Associates; 1990.
-
- Colombo J, Freeseman LJ, Coldren JT, Frick JE. Individual differences in infant fixation duration: Dominance of global versus local stimulus properties. Cognitive Development. 1995;10:271–285.
Grants and funding
LinkOut - more resources
Full Text Sources
Miscellaneous
