Clinical Trial
. 2011 Sep;16(9):959-66.
doi: 10.1007/s10495-011-0620-2.

Low doses of the novel caspase-inhibitor GS-9450 leads to lower caspase-3 and -8 expression on peripheral CD4+ and CD8+ T-cells

Affiliations
Clinical Trial

Low doses of the novel caspase-inhibitor GS-9450 leads to lower caspase-3 and -8 expression on peripheral CD4+ and CD8+ T-cells

J E Arends et al. Apoptosis. 2011 Sep.

Abstract

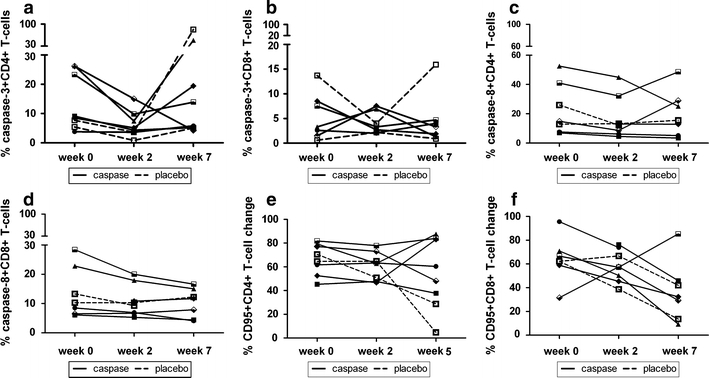
Chronic hepatitis C virus (HCV) infection is characterized by increased rates of apoptotic hepatocytes and activated caspases have been shown in HCV-infected patients. GS-9450, a novel caspase-inhibitor has demonstrated hepatoprotective activity in fibrosis/apoptosis animal models. This study evaluated the effects of GS-9450 on peripheral T-cell apoptosis in chronic HCV-infected patients. As sub study of the GS-US-227-0102, a double-blind, placebo-controlled phase 2a trial evaluating the safety and tolerability of GS-9450, apoptosis of peripheral CD4+ and CD8+ T-cells was measured using activated caspase-3, activated caspase-8 and CD95 (Fas). Blood samples were drawn at baseline, day 14 after therapy and at 5 weeks off-treatment follow-up in the first cohort of 10 mg. In contrast to the placebo-treated patients, GS-9450 caused a median of 46% decrease in ALT-values from baseline to day 14 in all treated patients (median of 118-64 U/l) rising again to a median of 140 U/l (19%) at 5 weeks off-treatment follow-up. In GS9450-treated patients, during treatment and follow-up, percentages of activated caspase-3+ and caspase-8 expression tended to decrease, in contrast to placebo-treated patients. Interestingly, compared to healthy controls, higher percentages of caspase-3 and caspase-8 positive CD4+ and CD8+ T-cells were demonstrated in HCV-infected patients at baseline. Decreased ALT-values were observed in all HCV-infected patients during treatment with low dose of the caspase-inhibitor GS-9450 accompanied by a lower expression of caspase-3 and -8 on peripheral T-cells. Furthermore, at baseline percentages of activated caspase-3, activated caspase-8 and CD95+ T-cells were higher in chronic HCV-infected patients compared to healthy controls.


Figures

Fig. 1
Fig. 1
Longitudinal analysis of ALT and HCV-RNA during therapy. Changes (%) in plasma ALT (a) and change in HCV-RNA values (b) from baseline during the duration of the study. On the y-axis are the % change in ALT (U/l) and the ΔHCV-RNA (log10 IU/ml) depicted. On the x-axis the weeks of the study are shown. Patients treated with the caspase-inhibitor GS-9450 are represented by the solid black lines and black dots and those receiving placebo are represented by the black dotted lines and open squares
Fig. 2
Fig. 2
Flow cytometry analysis of caspase-3 and CD95 expression. a Representation of a scatter plot defining a patient’s CD4+ and CD8+ populations on the left. The middle and right plots represent expression of activated caspase-3 and CD95 in a healthy control’s CD8+ T-cells (x-axis). b Flow cytometry dot plot showing a longitudinal expression of activated caspase-3 and CD95 in a chronic HCV-infected patient treated with the caspase-inhibitor GS-9450. The upper row depicts the caspase-3 expression while the lower row shows the CD95 expression (y-axis). From left to right, the study weeks 0, 2 and 7 are depicted
Fig. 3
Fig. 3
Baseline expression of activated caspase-3 and CD95 in peripheral T-cells. Comparison of activated caspase-3 (a), caspase-8 (b) and CD95 (c) expression on peripheral T-cells between patients in the GS-9450 study at baseline and healthy controls (HC). On the y-axis the percentages of either activated caspase-3, caspase-8 or CD95 are depicted. The black dots represent CD4 T-cells and the black squares the CD8 T-cells. Of 1 patient FACS analysis of CD8+ T-cells failed resulting in 7 patients being evaluated. CD4+ T-cells of 2 HC were unavailable for caspase-8 analysis
Fig. 4
Fig. 4
Longitudinal analysis of activated caspase-3, caspase-8 and CD95 expression Longitudinal analysis of CD4+ and CD8+ T-cells expressing activated caspase-3 (a, b), caspase-8 (c, d) and CD95 (e, f) during therapy. On the y-axis percentages of either activated caspase-3, caspase-8 or CD95 are shown and on the x-axis the weeks of the study are depicted. The black solid lines represent the patients receiving GS-9450 and the black dotted lines represent those taking placebo. One patient’s CD8+ T-cells at baseline (see Fig. 3) and another patient’s CD8+ T-cells at week 7 were not available for analysis

References

    1. Lauer GM, Walker BD. Hepatitis C virus infection. N Engl J Med. 2001;345:41–52. doi: 10.1056/NEJM200107053450107. - DOI - PubMed
    1. Rockey DC, Bissell DM. Noninvasive measures of liver fibrosis. Hepatology. 2006;43:S113–S120. doi: 10.1002/hep.21046. - DOI - PubMed
    1. Hotchkiss RS, Strasser A, McDunn JE, Swanson PE. Cell death. N Engl J Med. 2009;361:1570–1583. doi: 10.1056/NEJMra0901217. - DOI - PMC - PubMed
    1. Malhi H, Gores GJ. Cellular and molecular mechanisms of liver injury. Gastroenterology. 2008;134:1641–1654. doi: 10.1053/j.gastro.2008.03.002. - DOI - PMC - PubMed
    1. Schulze-Osthoff K, Ferrari D, Los M, Wesselborg S, Peter ME. Apoptosis signaling by death receptors. Eur J Biochem. 1998;254:439–459. doi: 10.1046/j.1432-1327.1998.2540439.x. - DOI - PubMed

Publication types

MeSH terms