Comparative Study
. 2011 Jun 13:11:70.
doi: 10.1186/1471-230X-11-70.

Discrimination of individuals in a general population at high-risk for alcoholic and non-alcoholic fatty liver disease based on liver stiffness: a cross section study

Affiliations
Comparative Study

Discrimination of individuals in a general population at high-risk for alcoholic and non-alcoholic fatty liver disease based on liver stiffness: a cross section study

Masaru Baba et al. BMC Gastroenterol. .

Abstract

Background: Factors associated with liver stiffness (LS) are unknown and normal reference values for LS have not been established. Individuals at high risk for alcoholic (ALD) and non-alcoholic fatty (NAFLD) liver disease need to be non-invasively discriminated during routine health checks. Factors related to LS measured using a FibroScan and normal reference values for LS are presented in this report.

Methods: We measured LS using a FibroScan in 416 consecutive individuals who presented for routine medical checks. We also investigated the relationship between LS and age, body mass index (BMI), liver function (LF), alcohol consumption, and fatty liver determined by ultrasonography. We identified individuals at high-risk for ALD and NAFLD as having a higher LS value than the normal upper limit detected in 171 healthy controls.

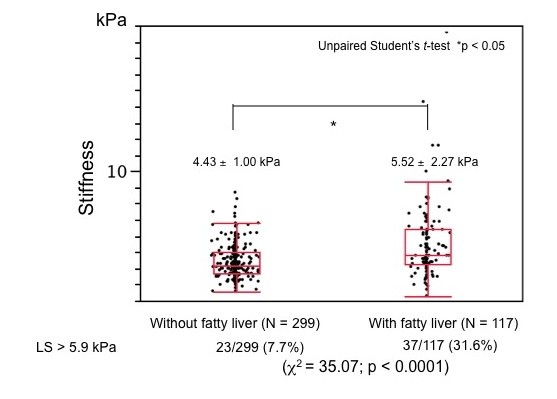
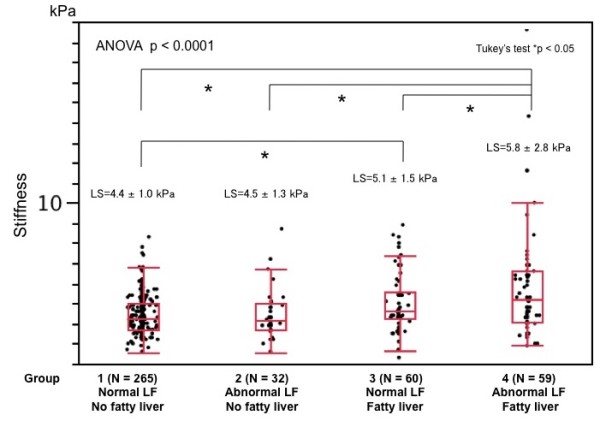
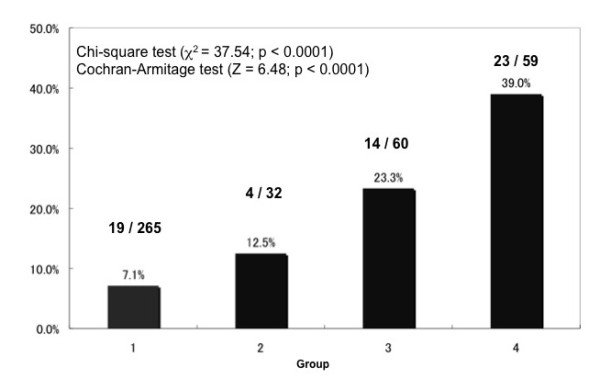
Results: The LS value for all individuals was 4.7 +/- 1.5 kPa (mean +/- SD) and LS significantly and positively correlated with BMI and LF test results. The LS was significantly higher among individuals with, than without fatty liver. Liver stiffness in the 171 healthy controls was 4.3 +/- 0.81 kPa and the upper limit of LS in the normal controls was 5.9 kPa. We found that 60 (14.3%) of 416 study participants had abnormal LS. The proportion of individuals whose LS values exceeded the normal upper limit was over five-fold higher among those with, than without fatty liver accompanied by abnormal LF test results.

Conclusions: Liver stiffness could be used to non-invasively monitor the progression of chronic liver diseases and to discriminate individuals at high risk for ALD and NAFLD during routine health assessments.


Figures

Figure 1
Figure 1
Flow diagram of study protocol. Seven individuals were excluded because LS could not be measured due to extensive intercostal subcutaneous tissue. We excluded 250 individuals based on four criteria and selected 165 healthy controls from the included population.
Figure 2
Figure 2
Comparison of liver stiffness among three groups based on BMI. Mean LS significantly differed among groups and were corrected for multiple comparisons according to Tukey's test. Proportions of individuals with LS above normal upper limit significantly differed (χ2 test and Cochran-Armitage test for trends).
Figure 3
Figure 3
Comparison of liver stiffness based on presence or absence of fatty liver. Values for LS were significantly higher among individuals with, than without fatty liver. Ratios of those with LS above normal upper limit significantly differed (χ2 test).
Figure 4
Figure 4
Comparison of liver stiffness between two groups based on alcohol consumption. Liver stiffness did not significantly differ between non/occasional and habitual consumption groups. However, ratios of those with higher LS than normal upper limit were significantly higher in habitual, than in non/occasional group (χ2 test).
Figure 5
Figure 5
Comparison of liver stiffness among four groups based on liver dysfunction and fatty liver. Liver stiffness significantly differed among these groups. Liver stiffness was highest in Group 4 and that of Group 3 was higher than that of Group 1 according to multiple comparisons (Tukey's test).
Figure 6
Figure 6
Ratios of individuals in four groups with liver stiffness beyond normal upper limit. Ratios of individuals with LS beyond the normal upper limit significantly differed (χ2 test and Cochran-Armitage test for trend).
Figure 7
Figure 7
Comparison of liver stiffness among four groups based on alcohol consumption and fatty liver. All participants were assigned to two groups based on alcohol consumption and then each group was further divided into two subgroups with or without fatty liver according to ultrasonography (Groups A, B, C, D). About 7% (6.9% and 7.5%) of all participants had LS above 5.9 kPa among those with NAFLD or ALD regardless of fatty liver.

References

    1. Neuschwander-Tetri BA, Caldwell SH. Nonalcoholic steatohepatitis: summary of an AASLD Single Topic Conference. Hepatology. 2003;37:1202–19. doi: 10.1053/jhep.2003.50193. - DOI - PubMed
    1. Ratziu V, Charlotte F, Heurtier A, Gombert S, Giral P, Bruckert E, Grimaidi A, Capron F. Sampling variability of liver biopsy in nonalcoholic fatty liver disease. Gastroenterology. 2005;128:1898–906. doi: 10.1053/j.gastro.2005.03.084. - DOI - PubMed
    1. Bedossa P, Dargere D, Paradis V. Sampling variability of liver fibrosis in chronic hepatitis C. Hepatology. 2003;38:1449–57. - PubMed
    1. Maharaj B, Maharaja RJ, Leary WP, Coopan RM, Naran AD, Pirie D. Sampling variability and its influence on the diagnostic yield of percutaneous needle biopsy of the liver. Lancet. 1986;8:523–5. doi: 10.1016/S0140-6736(86)90883-4. - DOI - PubMed
    1. Regev A, Berho M, Jeffers LJ, Milikowski C, Molina EG, Pyrsopoulos NT, Feng Z-Z, Reddy KR, Schiff ER. Sampling error and intraobserver variation in liver biopsy in patients with chronic HCV infection. Am J Gastroenterol. 2002;97:2614–8. doi: 10.1111/j.1572-0241.2002.06038.x. - DOI - PubMed

Publication types

MeSH terms