. 2011 Jun 16;9(6):496-507.
doi: 10.1016/j.chom.2011.05.006.

Viral infection augments Nod1/2 signaling to potentiate lethality associated with secondary bacterial infections

Affiliations

Viral infection augments Nod1/2 signaling to potentiate lethality associated with secondary bacterial infections

Yun-Gi Kim et al. Cell Host Microbe. .

Abstract

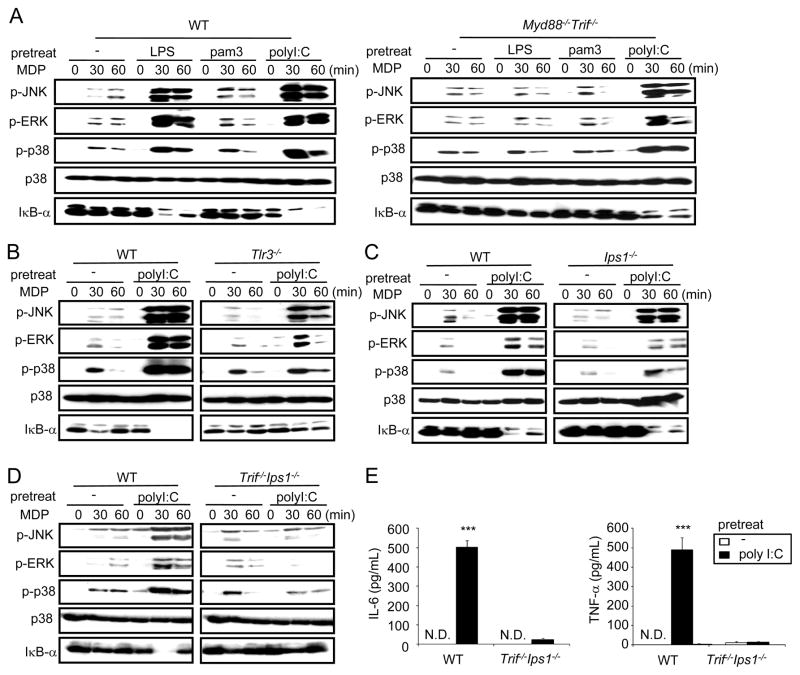
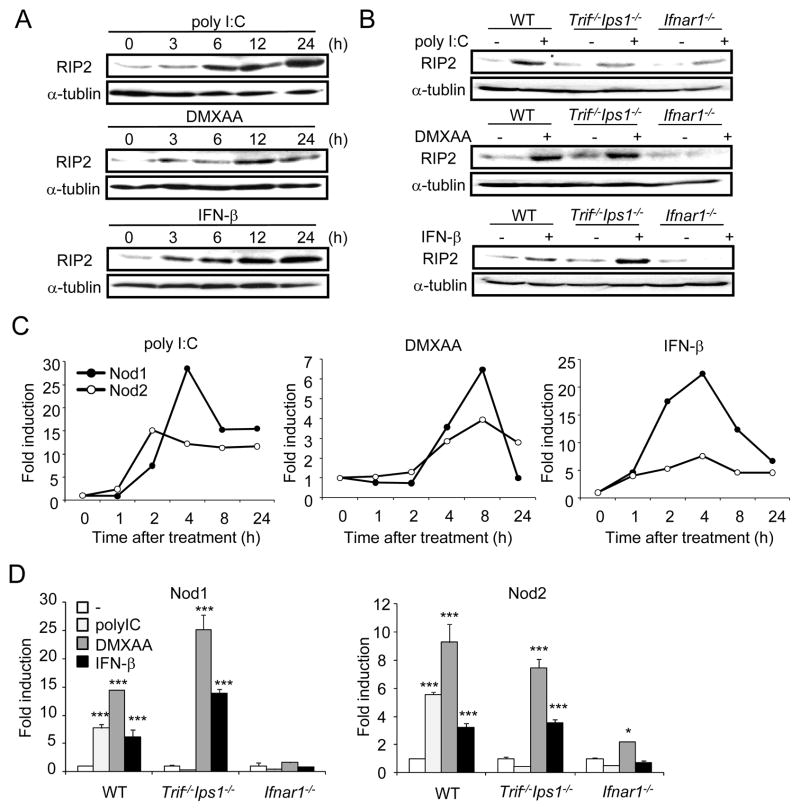
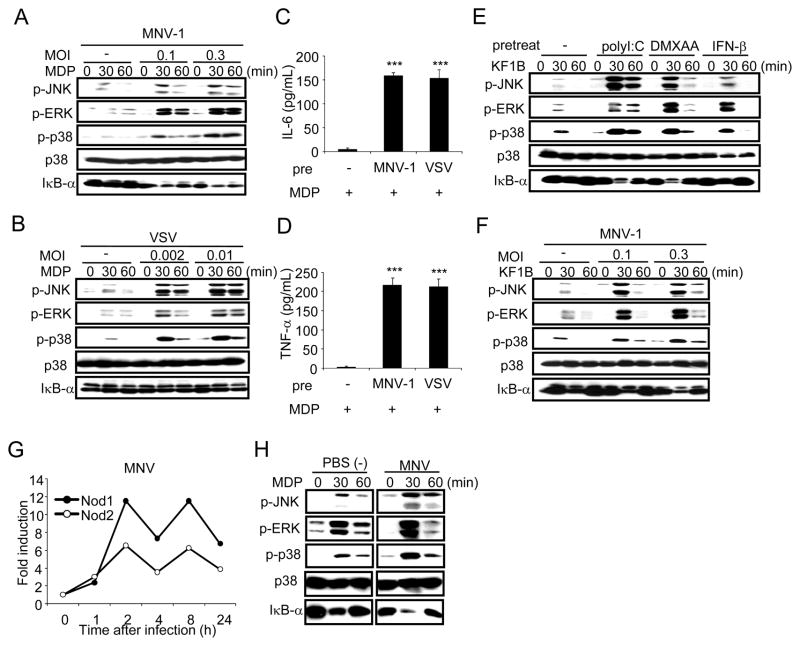
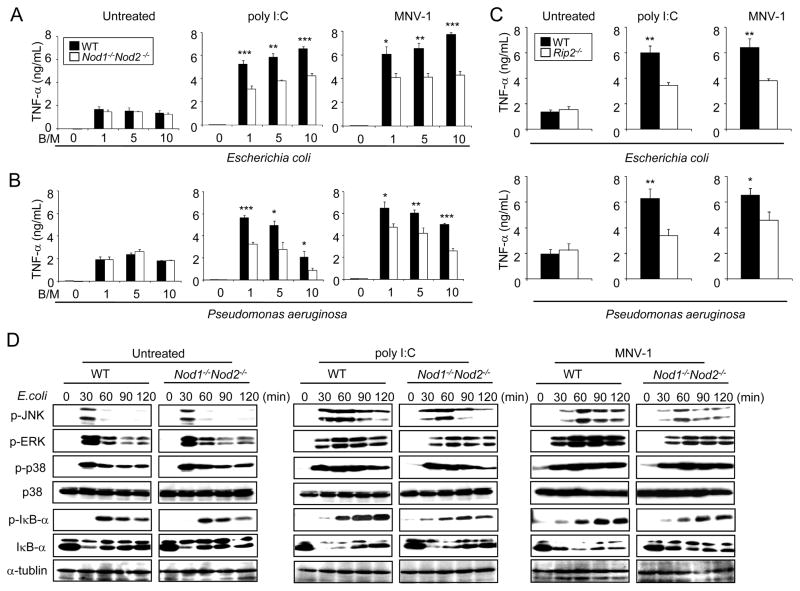
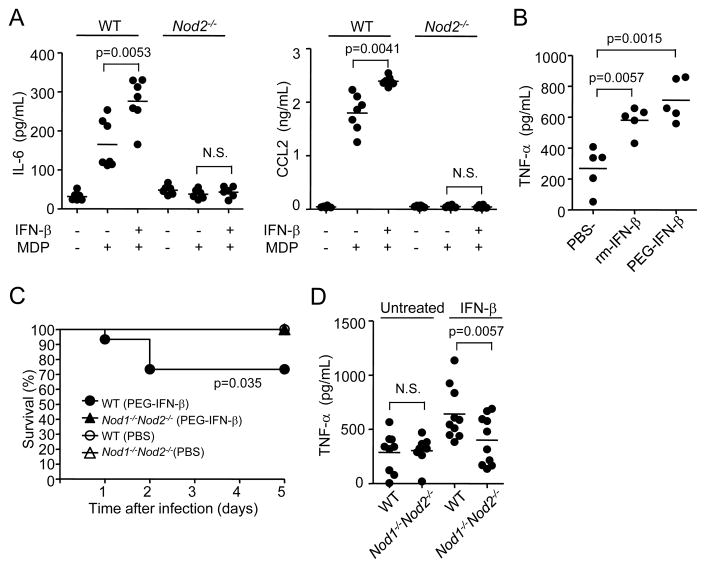
Secondary bacterial infection is a common sequela to viral infection and is associated with increased lethality and morbidity. However, the underlying mechanisms remain poorly understood. We show that the TLR3/MDA5 agonist poly I:C or viral infection dramatically augments signaling via the NLRs Nod1 and Nod2 and enhances the production of proinflammatory cytokines. Enhanced Nod1 and Nod2 signaling by poly I:C required the TLR3/MDA5 adaptors TRIF and IPS-1 and was mediated by type I IFNs. Mechanistically, poly I:C or IFN-β induced the expression of Nod1, Nod2, and the Nod-signaling adaptor Rip2. Systemic administration of poly I:C or IFN-β or infection with murine norovirus-1 promoted inflammation and lethality in mice superinfected with E. coli, which was independent of bacterial burden but attenuated in the absence of Nod1/Nod2 or Rip2. Thus, crosstalk between type I IFNs and Nod1/Nod2 signaling promotes bacterial recognition, but induces harmful effects in the virally infected host.


Conflict of interest statement

CONFLICT OF INTEREST:

Darren P. Baker is employed by Biogen Idec. Biogen Idec provided unmodified and PEGylated murine IFN-β for these studies at no cost and did not provide funds for these studies, nor was Biogen Idec involved in the study design, data analysis or any decisions relating to manuscript preparation or submission.

Figures

Figure 1
Figure 1. Poly I:C augments Nod2 activation via TRIF- and IPS-1-dependent signaling pathways in macrophages
(A–D) BMDMs from WT and indicated mutant mice were left untreated (−) or pretreated with LPS (A), pam3CSK4 (A), or poly I:C (A–D) for 24 h and then restimulated with MDP. Cell extracts were collected at the indicated times and assessed for MAPK and NF-κB activation using phosphospecific antibodies. (E) BMDMs from WT and Trif−/−Ips1−/− mice were treated with poly I:C or left untreated for 24 h. The macrophages were then re-stimulated with MDP. Cell-free supernatants were analyzed by ELISA for production of IL-6 and TNF-α. (*** p < 0.001, compared with untreated and poly I:C-treated or WT and mutant macrophage cultures). N.D. denotes not detected. Results are representative of 2 or 3 independent experiments. Data are expressed as mean ± S.D.
Figure 2
Figure 2. Enhancement of Nod2 signaling by poly I:C and the chemotherapeutic molecule DMXAA is mediated via type-I IFNs
(A and C) BMDMs from WT and Ifnar1−/− mice were left untreated (control) or pretreated with poly I:C (A), DMXAA, or IFN-β (C) for 24 h and then restimulated with MDP. Cell extracts were collected at the indicated times and assessed for MAPK and NF-κB activation using phosphospecific antibodies. (B and D) BMDMs from WT, Ifnar1−/− (B), or Nod2−/− mice (D) were treated with poly I:C, DMXAA, or left untreated for 24 h and then re-stimulated with MDP. Cell-free supernatants were analyzed for production of IL-6 and TNF-α (*** p < 0.001, compared with WT and mutant macrophage cultures). N.D. denotes not detected. Results are representative of 3 independent experiments. Data are expressed as mean ± S.D.
Figure 3
Figure 3. Type-I IFN signaling induces expression of RIP2
(A) BMDMs from WT mice were treated with poly I:C, DMXAA, or IFN-β for the indicated times, and cell extracts were assessed for RIP2 and α-tubulin levels by immunoblotting. (B) BMDMs from WT, Trif−/−Ips1−/−, and Ifnar1−/− mice were treated with poly I:C, DMXAA, or IFN-β for 24 h, and cell extracts were assessed for RIP2 and α-tubulin levels by immunoblotting. (C) BMDMs from WT mice were treated with poly I:C, DMXAA, or IFN-β for the indicated times, and total RNA was isolated to analyze for Nod1 and Nod2 expression. Gene expression was normalized to that of β-actin. (D) BMDMs from WT, Trif−/−Ips1−/−, and Ifnar1−/− mice were treated with poly I:C, DMXAA, or IFN-β for 8 h, and total RNA was isolated to analyze expression of Nod1 and Nod2. * p < 0.05, *** p < 0.001, comparison between untreated and treated macrophage cultures. Results are representative of 2 or 3 independent experiments.
Figure 4
Figure 4. Viral infection augments Nod1 and Nod2 signaling
(A and B) BMDMs from WT mice were mock-infected (−) or infected with MNV-1 at MOIs of 0.1 and 0.3 (A) or VSV at MOIs of 0.002 and 0.01 (B) for 24 h and then restimulated with MDP. Cell extracts were collected at the indicated times and assessed for MAPK and NF-κB activation using phosphospecific antibodies. (C and D) BMDMs from WT mice were mock-infected (−) or infected with MNV-1 at MOI of 0.3 or VSV at MOI of 0.01 for 24 h. The macrophages were then restimulated with MDP. Cell-free supernatants were analyzed for IL-6 (C) and TNF-α (D) production. (*** p < 0.001, compared with mock-infected and infected cultures). (E and F) BMDMs from WT mice were left untreated (−) or treated with poly I:C, DMXAA, or IFN-β (E) or infected with MNV-1 (F) for 24 hr and then restimulated with the Nod1 ligand KF1B. Cell extracts were collected at the indicated times and assessed for MAPK and NF-κB activation using phosphospecific antibodies. (G) BMDMs from WT mice were infected with MNV-1 for the indicated times, and total RNA was isolated to analyze for the expression of Nod1 and Nod2. (H) WT mice were injected i.p. with thioglycollate for 3 days and then treated with PBS(−) or infected with MNV-1 (1 × 10⁶ PFU/mouse) i. p. Elicited peritoneal macrophages were isolated 24 h after MNV-1 infection and stimulated with MDP ex-vivo. Cell extracts were collected at the indicated time and assessed for MAPK and NF-κB activation using phosphospecific antibodies. Data are expressed as mean ± S.D. Results are representative of 3 independent experiments.
Figure 5
Figure 5. Nod1 and Nod2 contribute to bacteria-induced TNF-α production and NF-κB activation in macrophages infected with MNV-1
(A and B) BMDMs from WT and Nod1−/−Nod2−/− mice were left untreated, treated with poly I:C, or infected with MNV-1 for 24 h and then infected with live E. coli (A) or P. aeruginosa (B) at a bacteria/macrophage ratio (B/M) of 1, 5, and 10. Cell-free supernatants were analyzed for production of TNF-α (* p < 0.05, ** p < 0.01, *** p < 0.001, compared with WT and mutant macrophages cultures). (C) BMDMs from WT and Rip2−/− mice were left untreated, treated with poly I:C, or infected with MNV-1 for 24 h and then infected with live E. coli or P. aeruginosa at a bacterial/macrophage ratio (B/M) of 1. Cell free supernatants were analyzed for production of TNF-α (* p < 0.05, ** p < 0.01, compared with WT and mutant macrophages cultures). (D) BMDMs from WT and Nod1/Nod2−/− mice were left untreated or treated with poly I:C or infected with MNV-1 for 24 h and then infected with E. coli at bacteria/macrophage ratio of 10 for the indicated times. Cell extracts were assessed for MAPK, NF-κB activation and α-tubulin levels by immunoblotting. Data are expressed as mean ± S.D. Results are representative of 3 independent experiments
Figure 6
Figure 6. Murine norovirus infection promotes bacteria-induced TNF-α production and lethality in mice via Nod1 and Nod2
(A and B) WT, and Nod1−/−Nod2−/− mice were injected i.p. with PBS (n=5) or poly I:C (200 μg/mouse, n=10) and then infected with E. coli 3 × 10⁸ CFU/mouse i. p. 24 h after poly I:C administration. Lethality was monitored for 5 days after infection (A). At 3 h post-infection, the levels of TNF-α in serum were assessed by ELISA (n=5 or 10) (B). (C and D) WT, and Nod1−/−Nod2−/− mice were injected with PBS or poly I:C (200 μg/mouse) i.p. and then infected with P. aeruginosa 2.5 × 10⁷ CFU/mouse i. n. 24 h after poly I:C administration. Lethality was monitored for 5 days after infection (n=10–11) (C). At 3 hrpost-infection, the level of TNF-α in lung homogenates was assessed by ELISA (n=6) (D) (E–I) WT, Nod1−/−Nod2−/−, and Rip2−/− mice were mock-infected or infected orally with MNV-1 (1 × 10⁷ PFU/mouse) and then infected with E. coli 3 × 10⁸ CFU/mouse i. p. 24 h after the MNV-1 infection. Lethality was monitored for 5 days after E. coli infection (n=9–10) (E). Bacterial loads in lung (F) and blood (G) samples were determined at 8 h post-infection by plating (n=7–8). The short black horizontal lines show the mean values for the groups. Each symbol represents one animal. N.S. denotes not significant. At 3 h post-infection, serum TNF-α levels were assessed by ELISA (n=9–10). N.S. denotes not significant (H). 1 h before E. coli infection, WT mice were injected i.p. with control rat IgG or anti-TNF-α rat IgG and lethality was monitored for 5 days after infection (n=10) (I). Data are expressed as mean ± S.D. Results are representative of 2 or 3 independent experiments.
Figure 7
Figure 7. IFN-β enhances MDP-induced cytokine production in vivo and promotes bacteria-induced lethality via Nod1 and Nod2
(A) WT (n=7), and Nod2−/− (n=6) mice were injected with PBS or PEGylated murine IFN-β (5 × 10³ U/mouse) i.p. and 18 h later injected with MDP (300 μg/mouse). 3 h later, the levels of IL-6 and CCL2 in serum were assessed by ELISA. (B) WT mice (n=5/group) were injected with PBS or PEGylated murine IFN-β (5 × 10³ U/mouse) i. p. or with unmodified murine IFN-β (2.5 × 10⁴ U/mouse, twice separated by 3 h) s.c. and 18 h later infected with 3 × 10⁸ CFU of E. coli/mouse. 3 h post-injection with E. coli, the level of TNF-α in serum was assessed by ELISA. (C) WT, and Nod1−/−Nod2−/− mice were injected with PBS (n=15) or PEGylated murine IFN-β (5 × 10³ U/mouse, n=15) i.p. and 18 h later infected with 3 × 10⁸ CFU of E. coli/mouse i. p. Mouse survival was monitored for 5 days after infection. (D) 3 h post-infection, the level of TNF-α in serum was assessed by ELISA (n=9 or 10).

Comment in

References

    1. Akira S, Uematsu S, Takeuchi O. Pathogen recognition and innate immunity. Cell. 2006;124:783–801. - PubMed
    1. Barnes AJ, Johnson AS, Shelly MP, Orton CI. Bacterial superinfection in chickenpox….but it can occur at any age. BMJ. 1996;313:1145. - PMC - PubMed
    1. Beadling C, Slifka MK. How do viral infections predispose patients to bacterial infections? Curr Opin Infect Dis. 2004;17:185–191. - PubMed
    1. Bernhagen J, Calandra T, Mitchell RA, Martin SB, Tracey KJ, Voelter W, Manogue KR, Cerami A, Bucala R. MIF is a pituitary-derived cytokine that potentiates lethal endotoxaemia. Nature. 1993;365:756–759. - PubMed
    1. Beutler B, Milsark IW, Cerami AC. Passive immunization against cachectin/tumor necrosis factor protects mice from lethal effect of endotoxin. Science. 1985;229:869–871. - PubMed

Publication types

MeSH terms