. 2011 Aug 12;286(32):28533-43.
doi: 10.1074/jbc.M111.244327. Epub 2011 Jun 13.

Retinoic acid signaling sequentially controls visceral and heart laterality in zebrafish

Affiliations

Retinoic acid signaling sequentially controls visceral and heart laterality in zebrafish

Sizhou Huang et al. J Biol Chem. .

Abstract

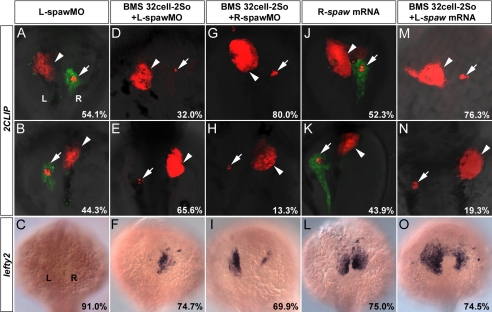
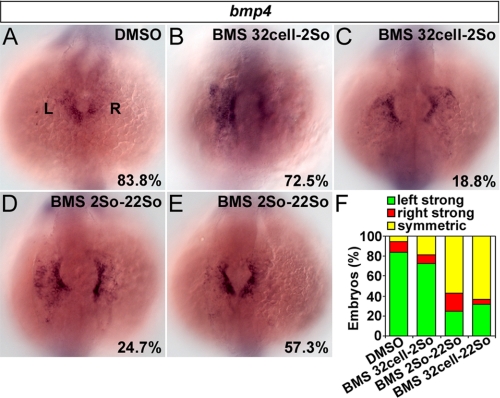
During zebrafish development, the left-right (LR) asymmetric signals are first established around the Kupffer vesicle (KV), a ciliated organ generating directional fluid flow. Then, LR asymmetry is conveyed and stabilized in the lateral plate mesoderm. Although numerous molecules and signaling pathways are involved in controlling LR asymmetry, mechanistic difference and concordance between different organs during LR patterning are poorly understood. Here we show that RA signaling regulates laterality decisions at two stages in zebrafish. Before the 2-somite stage (2So), inhibition of RA signaling leads to randomized visceral laterality through bilateral expression of nodal/spaw in the lateral plate mesoderm, which is mediated by increases in cilia length and defective directional fluid flow in KV. Fgf8 is required for the regulation of cilia length by RA signaling. Blockage of RA signaling before 2So also leads to mild defects of heart laterality, which become much more severe through perturbation of cardiac bmp4 asymmetry when RA signaling is blocked after 2So. At this stage, visceral laterality and the left-sided Nodal remain unaffected. These findings suggest that RA signaling controls visceral laterality through the left-sided Nodal signal before 2So, and regulates heart laterality through cardiac bmp4 mainly after 2So, first identifying sequential control and concordance of visceral and heart laterality.


Figures

FIGURE 1.
FIGURE 1.
Stage-dependent effects of RA antagonists on visceral laterality. A–D, in contrast to control embryos treated with DMSO (A), embryos treated with BMS453 from 32-cell to 2So not only exhibited defective differentiation and morphogenesis of visceral organs, but also showed aberrant visceral laterality (B and C). Embryos treated with BMS453 from 2So to 24 hpf exhibited normal visceral laterality (D). The gutGFP line was used and observed at 54 hpf. E–J, 91.7% of control embryos treated with DMSO exhibited visceral situs solitus (E). 51.4% of embryos treated with BMS453 from 32-cell to 2So displayed visceral situs solitus (p < 2.0 × 10⁻⁴; n = 212) (F), and 41.0% displayed visceral situs inversus (p < 2.0 × 10⁻⁴; n = 212) (G). 90.7% of embryos treated with BMS453 from 2So to 24 hpf showed visceral situs solitus (p > 0.39; n = 215) (H). In embryos treated with DEAB from 32-cell to 2So, 55.9% displayed visceral situs solitus (I), and 41.2% displayed visceral situs inversus (J). The 2CLIP transgenic line with liver and pancreatic β-cells labeled with DsRed and exocrine pancreas labeled with GFP was applied in the analysis and observed at 76 hpf. K, percentage of embryos showed different sideness of visceral organs. Arrowheads mark the liver and arrows mark the pancreas. p values were calculated against control embryos treated with DMSO. L, left side; R, right side; L/R-spawMO, predominant distribution of spawMO on the left/right side; L/R-spaw mRNA, unilateral distribution of spaw mRNA on the left/right side.
FIGURE 2.
FIGURE 2.
Stage-dependent effects of RA antagonists on heart laterality. A and B, 91.1% of control embryos treated with DMSO developed D-loop heart (A), whereas 8.9% developed L-loop heart (B). C–E, 66.3, 12.1, and 21.6% of embryos treated with BMS453 from 32-cell to 2So developed D-loop (p < 0.002; n = 199) (C), L-loop (p > 0.40; n = 199) (D), and midline heart (p < 2.0 × 10⁻⁴; n = 199) (E), respectively. F–H, 39.3, 24.3, and 36.4% of embryos treated with BMS453 from 2So to 53 hpf showed D-loop (p < 2.0 × 10⁻⁴; n = 199) (F), L-loop (p < 0.0041; n = 199) (G), and midline heart (p < 3.0 × 10⁻⁴; n = 199) (H), respectively. I–N, in embryos treated with DEAB from 32-cell to 2So, 72.5, 9.2, and 18.3% developed D-loop (I), L-loop (J), and midline heart (K), respectively. Those respective ratios became 46.0 (L), 24.8 (M), and 29.2% (N) when embryos were treated with DEAB from 2So to 53 hpf. O, percentage of embryos showed different heart laterality. Tg(cmlc2:GFP) transgenic embryos were observed at 53 hpf. p values were calculated against control embryos treated with DMSO. L, left side; R, right side; L/R-bmp4MO, predominant distribution of bmp4MO on the left/right side.
FIGURE 3.
FIGURE 3.
Stage-dependent effects of RA or RA antagonist on the left-sided Nodal signal in the LPM. 84.1 and 86.2% of DMSO-treated embryos showed left-sided spaw (A) and lefty2 (G), respectively. In contrast, 73.2 and 83.1% of embryos treated with BMS453 from 32-cell to 2So exhibited bilateral expression of spaw (p < 2.0 × 10⁻⁵; n = 71) (B) and lefty2 (p < 3.0 × 10⁻⁶; n = 65) (H), respectively. 83.6 and 79.8% of embryos treated with BMS453 from 2So to 22So displayed left-sided spaw (p > 0.93; n = 73) (C) and lefty2 (p > 0.09; n = 79) (I), respectively. 65.0 and 83.3% of embryos treated with RA at the shield stage for 1 h and 20 min exhibited bilateral expression of spaw (D) and lefty2 (J), respectively. 72.8 and 89.4% of embryos treated with RA at the 4-somite stage for 1 h and 20 min showed left-sided spaw (E) and lefty2 (K), respectively. F, percentage of embryos showed different sideness of spaw expression. L, percentage of embryos showed different sideness of lefty2 expression. No tail was applied to label the midline (G–K). Embryos were subjected to in situ hybridization at 22So and observed. M and N, expression of charon around KV at 10So in embryos with DMSO (M) or BMS453 (N) treatments before 2So. p values were calculated against control embryos treated with DMSO.
FIGURE 4.
FIGURE 4.
Control of visceral laterality by RA signaling before 2So is mediated by the left-sided Nodal signal in the LPM. A–C, in embryos with predominant distribution of spawMO on the left side, 54.1% exhibited visceral situs solitus (p < 8.0 × 10⁻⁴; n = 122) (A), 44.3% exhibited visceral situs inversus (p < 4.0 × 10⁻⁴; n = 122) (B), and 91.0% showed absent lefty2 expression (p < 9.0 × 10⁻⁵; n = 78) (C). D–F, in embryos with both BMS453 treatment from 32-cell to 2So and predominant distribution of spawMO on the left side, 32.0% exhibited visceral situs solitus (p < 7.0 × 10⁻⁵; n = 125) (D), 65.6% exhibited visceral situs inversus (p < 2.0 × 10⁻⁵; n = 125) (E), and 74.7% showed predominant lefty2 expression on the right side (p < 7.0 × 10⁻⁶; n = 91) (F). G–I, in embryos with both BMS453 treatment from 32-cell to 2So and predominant distribution of spawMO on the right side, 80.0% exhibited visceral situs solitus (p < 0.0017; n = 135) (G), 13.3% exhibited visceral situs inversus (p < 5.0 × 10⁻⁴; n = 135) (H), and 69.9% showed predominant lefty2 expression on the left side (p < 9.0 × 10⁻⁵; n = 103) (I). p values in G–I were calculated against embryos treated with BMS453 from 32-cell to 2So. J–L, in embryos with unilateral distribution of exogenous spaw mRNA on the right side, 52.3% exhibited visceral situs solitus (p < 5.0 × 10⁻⁴; n = 130) (J), 43.9% exhibited visceral situs inversus (p < 6.0 × 10⁻⁵; n = 130) (K), and 75.0% showed bilateral lefty2 expression (p < 4.0 × 10⁻⁶; n = 88) (L). Note that development of exocrine pancreas was unaffected (J and K). M–O, in embryos with both BMS453 treatment from 32-cell to 2So and unilateral distribution of exogenous spaw mRNA on the left side, 76.3% exhibited visceral situs solitus (p < 5.0 × 10⁻⁴; n = 207) (M), 19.3% exhibited visceral situs inversus (p < 0.0028; n = 207) (N), and 74.5% showed asymmetric lefty2 with stronger expression on the left side (p < 5.0 × 10⁻⁵; n = 106) (O). p values in M–O were calculated against embryos treated with BMS453 from 32-cell to 2So. Arrowheads mark the liver and arrows mark the pancreas. 2CLIP transgenic embryos were observed at 76 hpf. Embryos were subjected to in situ hybridization at 22So and observed. Unless specifically mentioned, p values were calculated against control embryos treated with DMSO. L, left side; R, right side; L/R-spawMO, predominant distribution of spawMO on the left/right side; L/R-spaw mRNA, unilateral distribution of spaw mRNA on the left/right side.
FIGURE 5.
FIGURE 5.
RA signaling before 2So regulates cilia length and KV fluid flow, in which Fgf8 is required. A and B, in contrast to control embryos treated with DMSO (A), the formation of KV was unaffected in embryos treated with BMS453 from 32-cell to 2So (B). Arrowheads mark the KV. C–F, in contrast to control embryos treated with DMSO (C), embryos treated with BMS453 from 32-cell to 2So displayed increased cilia length in KV (p < 0.0015) (D), which was rescued by the injection of fgf8MO (E). Overexpression of fgf8 mRNA alone was not sufficient to lead to increases in cilia length (F). G, the number of cilia between DMSO- and BMS453-treated embryos showed no obvious difference. H, in contrast to control embryos treated with DMSO, cilia lengths were increased in embryos treated with BMS453 from 32-cell to 2So (p < 0.0015), but not in embryos with both BMS453 treatment and fgf8MO injection (p > 0.88). Cilia length in embryos with fgf8 mRNA injection also showed no obvious difference (p > 0.63). I and J, in control embryos treated with DMSO, fluorescent beads had a persistent counterclockwise directional flow (I). Movement of beads in embryos with BMS453 treatment before 2So became non-directional (J). Green spots, red spots, and curves mark the start points, end points, and tracks of beads movements, respectively. K–P, in contrast to control embryos treated with DMSO (K, M, O), transcriptions of fgf8 (L) at the marginal zone as well as its downstream targets erm (N) and pea3 (P) were enhanced in embryos treated with BMS453 from 32-cell to 80% epiboly. Embryos were viewed from the bottom (K and L), the lateral (M and N), and the dorsal (O and P) sides. Q and R, low concentration (60 μm) of fgf8MO (R) efficiently rescued bilateral spaw expression caused by BMS453 treatment before 2So (Q). S and T, lateral (S) and bottom (T) view of raldh2 expression at 80%E with the dorsal side to the right. p values were calculated against control embryos treated with DMSO.
FIGURE 6.
FIGURE 6.
Stage-dependent effects of RA antagonist on cardiac bmp4 asymmetry. A, 83.8% of control embryos treated with DMSO showed stronger cardiac bmp4 on the left than on the right side. B and C, in contrast, 72.5 and 18.8% of embryos treated with BMS453 from 32-cell to 2So exhibited stronger cardiac bmp4 on the left side (p < 0.02; n = 80) (B) and symmetric cardiac bmp4 (p < 0.007; n = 80) (C), respectively. D and E, in embryos treated with BMS453 from 2So to 22So, 24.7 and 57.3% showed stronger bmp4 in the left cardiac field (p < 2.0 × 10⁻⁷; n = 89) (D) and symmetric bmp4 (p < 5.0 × 10⁻⁵; n = 89) (E), respectively. F, percentage of embryos showed different cardiac bmp4 asymmetries. Embryos were applied to in situ hybridization at 22So and observed. p values were calculated against control embryos treated with DMSO.
FIGURE 7.
FIGURE 7.
Control of heart laterality by later RA signaling after 2So is mediated by asymmetric bmp4. A–C, in embryos with both BMS453 treatment from 2So to 53 hpf and predominant distribution of bmp4MO on the right side, 61.4, 16.5, and 22.1% developed D-loop (p < 0.0065; n = 127) (A), L-loop (p < 0.0021; n = 127) (B), and midline (p < 0.02; n = 127) (C) heart, respectively. Living Tg(cmlc2:GFP) transgenic embryos were observed at 53 hpf. p values were calculated against embryos treated with BMS453 from 2So to 53 hpf. D and E, in wild type embryos at 10So, 81.8% exhibited slightly asymmetric raldh2 with stronger expression on the left side in the anterior LPM (D), whereas 13.6% showed symmetric raldh2 expression (E). The line marks the position of the section plane shown in F and G. F, sections illustrated asymmetric expression of raldh2 in the anterior LPM at 10So. G, in situ image of the section was overlaid with DAPI counterstaining. H and I, slightly asymmetric expression of raldh2 in the anterior LPM initiated at 1–2So (H) and became evident at 3–4So (I). J, 73.9% of spaw morphants showed slightly asymmetric raldh2 with stronger transcription on the left side in the anterior LPM. Arrowheads mark the transcription of raldh2 in the anterior LPM. WT, wild type.

References

    1. Essner J. J., Vogan K. J., Wagner M. K., Tabin C. J., Yost H. J., Brueckner M. (2002) Nature 418, 37–38 - PubMed
    1. Essner J. J., Amack J. D., Nyholm M. K., Harris E. B., Yost H. J. (2005) Development 132, 1247–1260 - PubMed
    1. Yost H. J. (2003) Curr. Biol. 13, R808–R809 - PubMed
    1. Neugebauer J. M., Amack J. D., Peterson A. G., Bisgrove B. W., Yost H. J. (2009) Nature 458, 651–654 - PMC - PubMed
    1. Hong S. K., Dawid I. B. (2009) Proc. Natl. Acad. Sci. U.S.A. 106, 2230–2235 - PMC - PubMed

Publication types

MeSH terms

LinkOut - more resources