. 2011 Sep;4(5):659-72.
doi: 10.1242/dmm.007419. Epub 2011 Jun 13.

A Drosophila model for the Zellweger spectrum of peroxisome biogenesis disorders

Affiliations

A Drosophila model for the Zellweger spectrum of peroxisome biogenesis disorders

Fred D Mast et al. Dis Model Mech. 2011 Sep.

Abstract

Human peroxisome biogenesis disorders are lethal genetic diseases in which abnormal peroxisome assembly compromises overall peroxisome and cellular function. Peroxisomes are ubiquitous membrane-bound organelles involved in several important biochemical processes, notably lipid metabolism and the use of reactive oxygen species for detoxification. Using cultured cells, we systematically characterized the peroxisome assembly phenotypes associated with dsRNA-mediated knockdown of 14 predicted Drosophila homologs of PEX genes (encoding peroxins; required for peroxisome assembly and linked to peroxisome biogenesis disorders), and confirmed that at least 13 of them are required for normal peroxisome assembly. We also demonstrate the relevance of Drosophila as a genetic model for the early developmental defects associated with the human peroxisome biogenesis disorders. Mutation of the PEX1 gene is the most common cause of peroxisome biogenesis disorders and is one of the causes of the most severe form of the disease, Zellweger syndrome. Inherited mutations in Drosophila Pex1 correlate with reproducible defects during early development. Notably, Pex1 mutant larvae exhibit abnormalities that are analogous to those exhibited by Zellweger syndrome patients, including developmental delay, poor feeding, severe structural abnormalities in the peripheral and central nervous systems, and early death. Finally, microarray analysis defined several clusters of genes whose expression varied significantly between wild-type and mutant larvae, implicating peroxisomal function in neuronal development, innate immunity, lipid and protein metabolism, gamete formation, and meiosis.


Figures

Fig. 1.
Fig. 1.
Peroxins and their putative homologs in Drosophila. The putative Drosophila homologs of known peroxins that we identified in silico are presented. The main function in peroxisome biogenesis of each known peroxin is given. The PBD in which a PEX gene has been implicated is indicated in brackets. Pairwise alignment is made between the human or yeast peroxin (upper) and the putative Drosophila homolog (lower) using the SIM alignment algorithm (http://ca.expasy.org/tools/sim-prot.html) and visualized using Lalnview (http://pbil.univ-lyon1.fr/software/lalnview.html). The extent of amino acid similarity between regions of two aligned proteins is given by the Heat map at bottom. Hs, Homo sapiens; Yl, Yarrowia lipolytica; Dmel, Drosophila melanogaster.
Fig. 2.
Fig. 2.
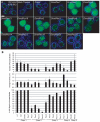
Peroxisomes are absent or exhibit altered morphology in S2 cells treated with dsRNA to putative Pex genes. (A) S2 cells constitutively expressing the fluorescent peroxisomal reporter protein GFP-SKL (Kural et al., 2005) were treated with dsRNA to the indicated putative Pex genes, mock-treated (MT) or treated with dsRNA targeting Dredd, which has no known role in peroxisome biogenesis or peroxisome function. GFP-SKL in S2 cells targets to punctae that are characteristic of peroxisomes. Mock-treated cells and cells treated with dsRNA targeting Dredd exhibited punctae in the same pattern as control cells (UT). Cells treated with dsRNAs to different Pex genes exhibited mislocalization of the GFP-SKL peroxisomal reporter to the cytosol and/or altered peroxisomal size and number. Cells treated with dsRNA to Pex7 or Pex20 exhibited punctate peroxisomes that were essentially like those of wild-type cells, because PEX7 and PEX20 affect the targeting only of peroxisomal proteins containing a PTS2 and not of those containing PTS1, such as GFP-SKL. (B) Quantitative description of peroxisome morphologies in S2 cells treated with dsRNA to putative Pex genes. Images were scored for numbers of punctate bodies, the average volume of these punctate bodies and the intensity of fluorescent signal from these punctate bodies.
Fig. 3.
Fig. 3.
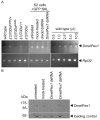
Detection of Pex1 transcripts by RT-PCR and of Pex1 protein by immunoblotting. (A) The specific bands corresponding to the expression levels of Pex1 and the gene Rpl32, encoding a ubiquitously expressed ribosomal protein and used as a loading control, are indicated by arrows. Heterozygous l(3)70Da animals are indicated by ‘/+’. The mRNA isolated from l(3)70DaS4648 homozygotes produced no Pex1-specific band, whereas l(3)70Da1 homozygous animals showed a severe reduction in this band compared with the Rpl32 loading control. Similarly, the level of Pex1 transcript was reduced in the dsRNA-treated S2 cells compared with untreated, mock-treated or S2 cells treated with a dsRNA that targets the Dredd gene, which is involved in the immune response. For each set of primers, specific amounts of the wild-type RT-reaction were analyzed to confirm that 2.5 μl of experimental sample yielded a product within the linear range of amplification by the subsequent PCR. (B) Pex1 protein is reduced specifically in cells treated with dsRNA to the Pex1 transcript. Lysates of untreated S2 cells, mock-treated S2 cells, S2 cells treated with dsRNA to Pex1 mRNA and S2 cells treated with dsRNA to Pex7 mRNA were separated by SDS-PAGE and subjected to immunoblotting with anti-Pex1 protein antibodies. Reduced levels of Pex1 protein are observed only in the lane containing lysate of S2 cells treated with dsRNA to Pex1 mRNA. A protein detected nonspecifically by the antibodies to Pex1 protein serves as a control for protein loading. Numbers at left represent the migrations of molecular mass standards in kDa.
Fig. 4.
Fig. 4.
Pex1s4868 homozygous larvae exhibit defects in growth. Each data point represents the average size in mm2 of 20 randomly selected Pex1s4868 homozygous (green), Pex1s4868 heterozygous (purple) and wild-type (blue) larvae. On day 4, the mean area, which represents growth, of Pex1s4868 homozygous larvae is significantly reduced, as compared with wild-type and heterozygous larvae (P<0.0001). Wild-type and heterozygous larvae did not show any statistically significant difference in growth. Error bars indicate standard deviation.
Fig. 5.
Fig. 5.
Pex1s4868 homozygous flies have a reduced lifespan. Survival curve of Pex1s4868 homozygous (green), Pex1s4868 heterozygous (red) and wild-type (blue) flies. All Pex1s4868 homozygous flies died by day 6 (pupariation). Wild-type and heterozygous larvae pupated on day 6. Error bars indicate standard deviation.
Fig. 6.
Fig. 6.
Pex1s4868 homozygous larvae are smaller in size than wild-type and heterozygous larvae, and fail to show coordinated movement towards food. (A) A histogram reporting the percentage of larvae that reach food in a fixed period of 20 minutes. All wild-type and heterozygous larvae, but no homozygous larvae, were able to reach the food source in the prescribed time. (B) Images of 5-day-old wild-type, Pex1s4868 heterozygous and Pex1s4868 homozygous larvae. Homozygous larvae are much smaller than heterozygous or wild-type larvae.
Fig. 7.
Fig. 7.
Pex1s4868 homozygous embryos exhibit an essentially wild-type musculature. Wild-type and Pex1s4868 homozygous mutant embryos (stage 15) were analyzed by immunofluorescence microscopy using monoclonal antibody MAC147 to myosin, which recognizes all muscle. Anterior is at right in all images. Lateral views are shown, dorsal is up. Scale bar: 100 μm.
Fig. 8.
Fig. 8.
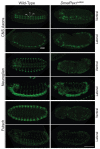
The overall pattern of CNS and PNS development is abnormal in Pex1s4868 homozygous embryos. Wild-type and Pex1s4868 homozygous embryos (stage 15) were analyzed by immunofluorescence microscopy using monoclonal antibodies BP102 (anti-CNS axons), BP104 (anti-Nrg; recognizing CNS and PNS neurons) and 22C10 (anti-Futsch; recognizing neuron and axon subsets of the CNS and PNS). Anterior is to the right in all images. In lateral views, dorsal is up for BP102 and 22C10 and down for BP104. ac, anterior commissure; lc, longitudinal connective; pc, posterior commissure; VNC, ventral nerve cord. Scale bar: 100 μm.
Fig. 9.
Fig. 9.
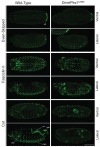
CNS and PNS neurons are disorganized in Pex1s4868 homozygous embryos. Wild-type and Pex1s4868 homozygous embryos (stage 15) were analyzed by immunofluorescence microscopy using monoclonal antibodies 2B8 (anti-Eve; recognizing the nuclei of a subset of CNS neurons), 1D4 (anti-Fas2; recognizing motor neurons and their axons in the ventral nerve cord) and 2B10 (anti-Cut; recognizing the nuclei of cells of external sensory organ precursors). Anterior is to the right in all images. In lateral views, dorsal is down for anti-Eve, and up for Fas2 and anti-Cut. ap, anal plate; asp, anterior spiracle; mt, Malpighian tubules; psp, posterior spiracle. Scale bar: 100 μm.
Fig. 10.
Fig. 10.
Glial cells are disorganized in Pex1s4868 homozygous embryos. Wild-type and Pex1s4868 homozygous embryos (stage 15) were analyzed by immunofluorescence microscopy using monoclonal antibodies 8D12 (anti-Repo; recognizing all glial cells except midline glia) and 10D3 (anti-Wrapper; recognizing midline glia). Anterior is to the right in all images. In lateral views, dorsal is up. Scale bar: 100 μm.
Fig. 11.
Fig. 11.
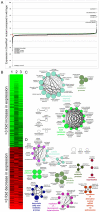
Systems level view of changes in gene expression in Pex1s4868 homozygous embryos. (A) Relative positive and negative changes in gene expression from an Affymetrix GeneChip arrays performed in triplicate using wild-type and Pex1s4868 homozygous embryos. (B) Heat maps for genes with more than a threefold change in expression levels in Pex1s4868 homozygous embryos. Bright red indicates a greater than tenfold decrease in expression levels, whereas bright green indicates a greater than tenfold increase in expression levels for genes annotated in FlyBase (http://www.flybase.org). The three color columns each represent the results from an individual experiment. (See supplementary material Table S4 for the corresponding list of genes for each row in the heat map.) (C,D) Genes whose expression levels were increased greater than threefold (C) or decreased more than threefold (D) in Pex1s4868 homozygous embryos as compared with wild-type are grouped according to gene ontology using the ClueGO plugin (http://www.ici.upmc.fr/cluego/cluegoDownload.shtml) for Cytoscape (http://www.cytoscape.org).

References

    1. Adams M. D., Celniker S. E., Holt R. A., Evans C. A., Gocayne J. D., Amanatides P. G., Scherer S. E., Li P. W., Hoskins R. A., Galle R. F., et al. (2000). The genome sequence of Drosophila melanogaster. Science 287, 2185–2195 - PubMed
    1. Bard F., Casano L., Mallabiabarrena A., Wallace E., Saito K., Kitayama H., Guizzunti G., Hu Y., Wendler F., DasGupta R., et al. (2006). Functional genomics reveals genes involved in protein secretion and Golgi organization. Nature 439, 604–607 - PubMed
    1. Beard M. E., Holtzman E. (1987). Peroxisomes in wild-type and rosy mutant Drosophila melanogaster. Proc. Natl. Acad. Sci. USA 84, 7433–7437 - PMC - PubMed
    1. Bilen J., Bonini N. M. (2005). Drosophila as a model for human neurodegenerative disease. Annu. Rev. Genet. 39, 153–171 - PubMed
    1. Bindea G., Mlecnik B., Hackl H., Charoentong P., Tosolini M., Kirilovsky A., Fridman W., Pagès F., Trajanoski Z., Galon J. (2009). ClueGO: a Cytoscape plug-in to decipher functionally grouped gene ontology and pathway annotation networks. Bioinformatics 25, 1090–1093 - PMC - PubMed

Publication types

MeSH terms

Supplementary concepts