. 2011 Sep 1;589(17):4167-87.
doi: 10.1113/jphysiol.2011.209015. Epub 2011 Jun 13.

The spatio-temporal characteristics of action potential initiation in layer 5 pyramidal neurons: a voltage imaging study

Affiliations

The spatio-temporal characteristics of action potential initiation in layer 5 pyramidal neurons: a voltage imaging study

Marko A Popovic et al. J Physiol. .

Abstract

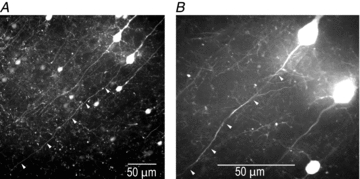
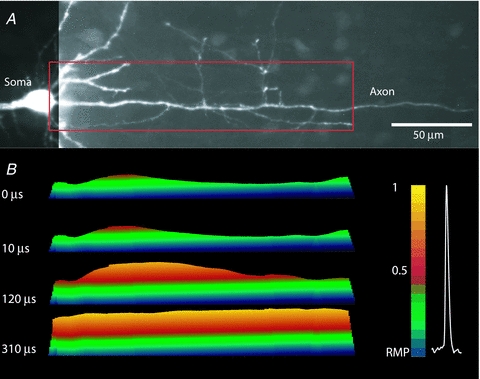
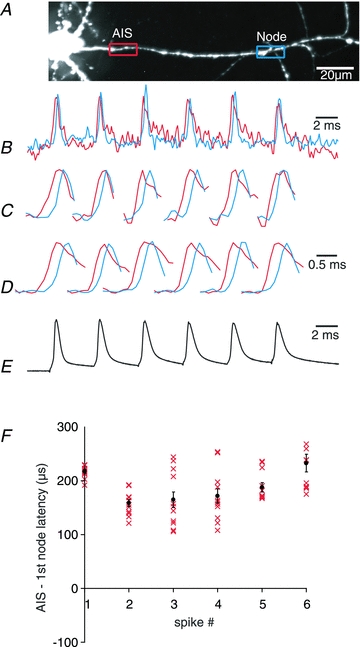
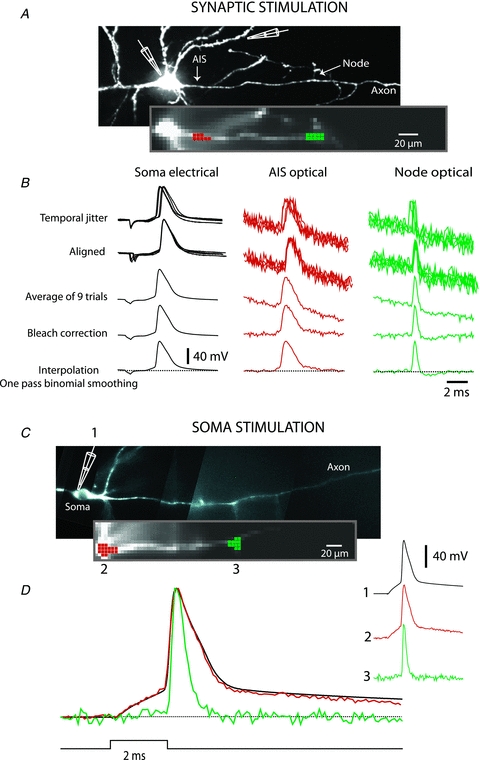
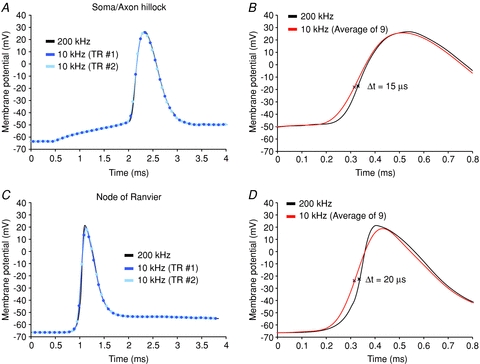
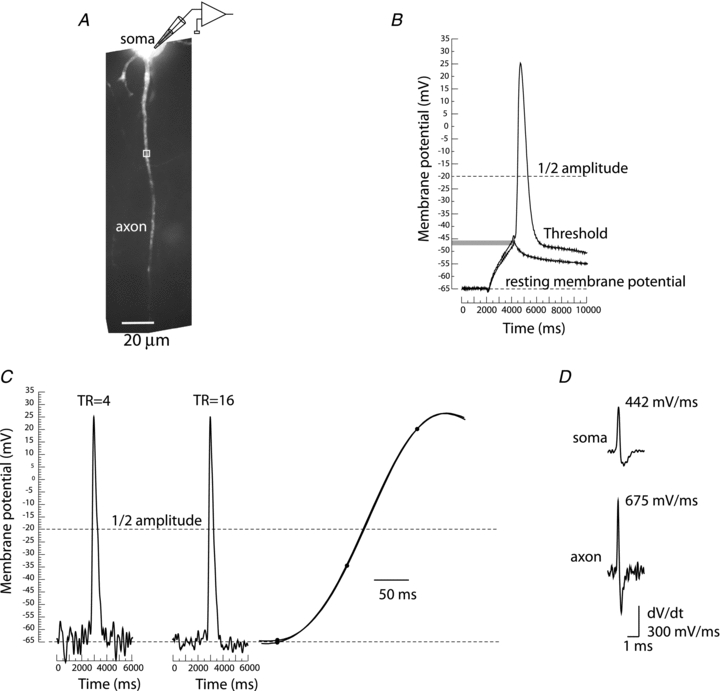
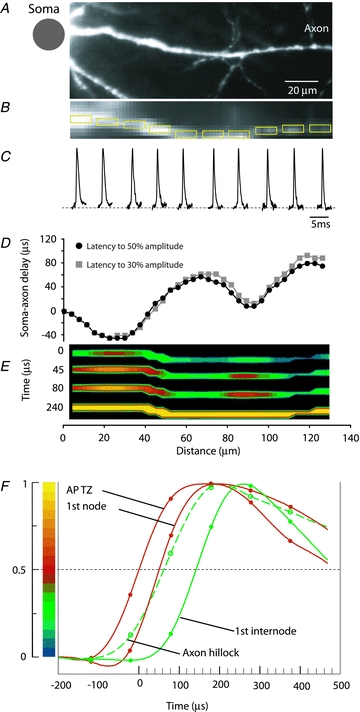
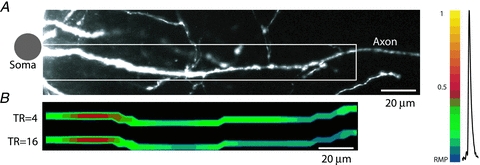
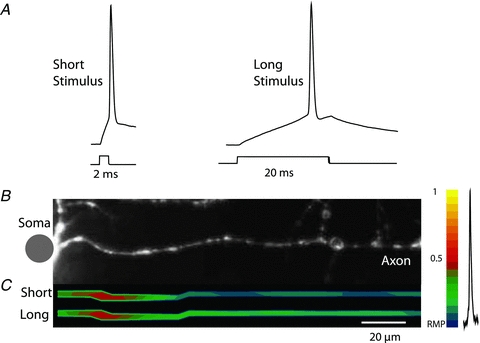
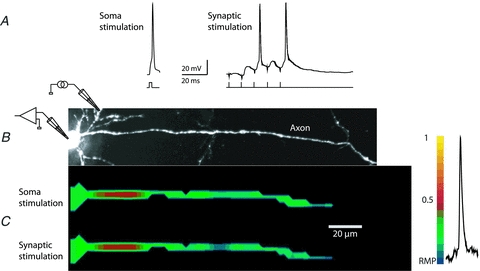
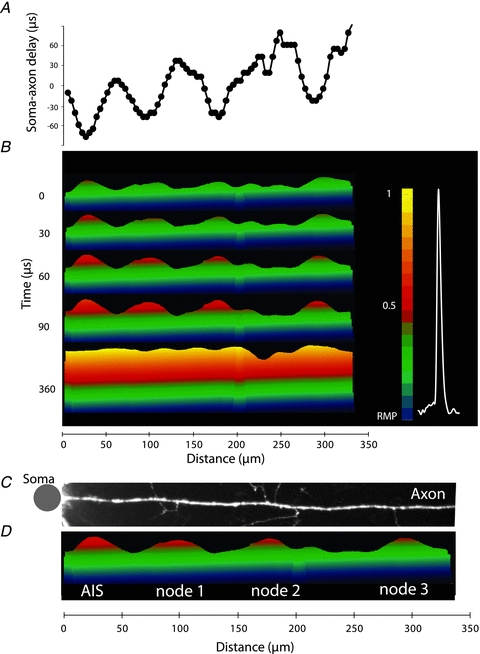
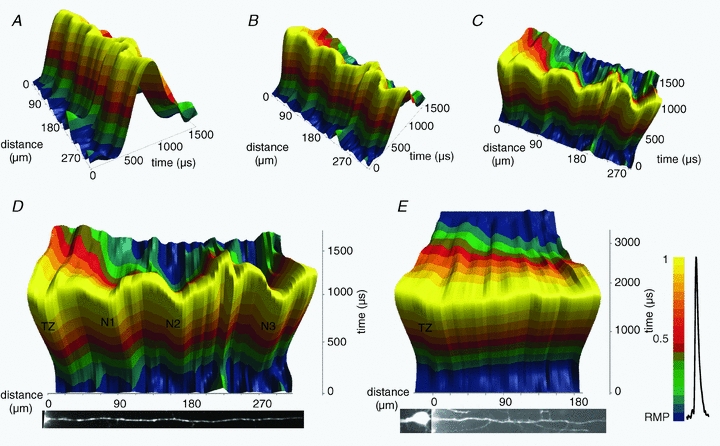
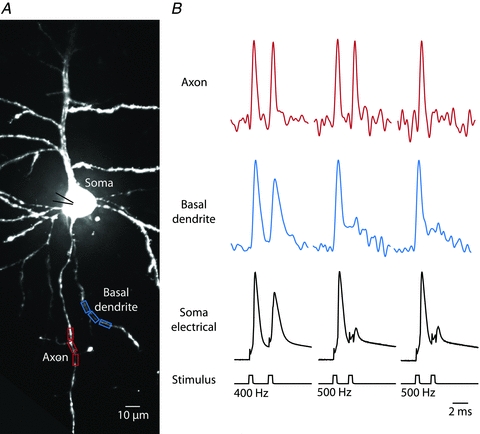
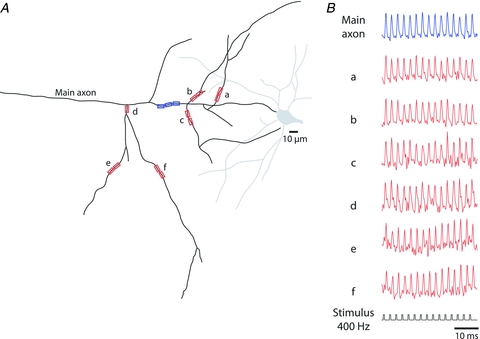
The spatial pattern of Na(+) channel clustering in the axon initial segment (AIS) plays a critical role in tuning neuronal computations, and changes in Na(+) channel distribution have been shown to mediate novel forms of neuronal plasticity in the axon. However, immunocytochemical data on channel distribution may not directly predict spatio-temporal characteristics of action potential initiation, and prior electrophysiological measures are either indirect (extracellular) or lack sufficient spatial resolution (intracellular) to directly characterize the spike trigger zone (TZ). We took advantage of a critical methodological improvement in the high sensitivity membrane potential imaging (V(m) imaging) technique to directly determine the location and length of the spike TZ as defined in functional terms. The results show that in mature axons of mouse cortical layer 5 pyramidal cells, action potentials initiate in a region ∼20 μm in length centred between 20 and 40 μm from the soma. From this region, the AP depolarizing wave invades initial nodes of Ranvier within a fraction of a millisecond and propagates in a saltatory fashion into axonal collaterals without failure at all physiologically relevant frequencies. We further demonstrate that, in contrast to the saltatory conduction in mature axons, AP propagation is non-saltatory (monotonic) in immature axons prior to myelination.


Figures

Figure 1
Figure 1. Selection of L5 cortical neurons for Vm imaging
Confocal images of L5 pyramidal neurons expressing EGFP in a cortical slice (Crym transgenic mouse line). Low (A) and high (B) magnification images of the same slice region; 488 nm excitation using Yokogawa spinning disk scanner. Axons of individual neurons are clearly visible. Cells with long intact axons (white arrows) in one plane of focus close to the surface of the slice were selected.
Figure 10
Figure 10. Initiation and propagation of an AP in unmyelinated axon
A, fluorescence confocal image of a dye loaded P6 pyramidal neuron; the soma, basal dendrites and a proximal part of the axon with several collaterals are clearly visible. Recording region indicated by red rectangle. B, time sequence of frames showing spatial profile of colour coded relative Vm amplitude in the axon at four characteristic time points: 0 μs – AP initiation at TZ; 10 and 120 μs – gradual depolarization; 310 μs – peak depolarization. Note the monotonic character of AP propagation. Membrane potential colour scale shown on right. See supplementary Movie 2.
Figure 12
Figure 12. Stability of spike TZ during repetitive firing
A, fluorescence confocal image of a dye loaded L5 pyramidal neuron; axon in recording position. Spike TZ location and the 1st node of Ranvier are indicated by red and blue rectangles. B, single trial recording of a train of APs from two locations (red: TZ; blue: 1st node). C, expanded traces of six individual AP signals from (B). Note that the signal from TZ consistently precedes the signal from the 1st node (delay > 0). D, average signals from 12 repetitions of single trial measurements shown in (B). E, electrical recording from the soma. F, plot of TZ–1st node AP latency values for individual spikes (1–6) in the train. Single trial measurements and average values ± SEM are shown.
Figure 2
Figure 2. Signal processing
A, synaptic stimulation. Upper image, high resolution confocal image of a stained neuron with axon in recording position. Recording electrode attached to soma and stimulating electrode next to basal dendrite shown schematically. Lower image, low spatial resolution fluorescence image of the axon obtained by CCD used for Vm imaging. B, electrode recordings from soma, optical recordings from spike TZ (red), and from node of Ranvier (green). Top traces: row data from 9 trials showing temporal jitter in AP initiation following synaptic activation. Second row of traces: temporally aligned signals. Third row of traces: averaged signal. Fourth raw of traces: bleach correction. Bottom traces: cubic spline interpolation with one pass of temporal smoothing. C, somatic stimulation. Upper image, high resolution confocal image of another neuron with axon in recording position. Lower image, low spatial resolution fluorescence image of the axon obtained by CCD used for Vm imaging. Traces on right: AP transients from three locations: 1-electrode recording from soma; 2-optical recording from axon hillock; 3-optical recording from the first node of Ranvier. Bottom traces: superimposed signal from same three locations.
Figure 3
Figure 3. Accuracy of AP waveform reconstruction
A, simulated AP signal from axon hillock characterized by the maximum rate of rise of 480 mV ms−1 sampled at 10 kHz. Two exemplar results of sampling at 10 kHz (light and dark blue) superimposed with simulated signal (black). B, simulated AP signal from axon hillock (black) superimposed with average of nine trials sampled at 10 kHz (red). The filtering effect of sampling at 10 kHz: the peak amplitude underestimated by 1%; the time to reach 50% of maximum amplitude shifted to the left on the time axis by 15 μs. C, simulated AP signal from node of Ranvier characterized by the maximum rate of rise of 1100 mV ms−1 (black) re-sampled at 10 kHz. Two exemplar results of sampling at 10 kHz (light and dark blue) superimposed with simulated signal (black). D, simulated AP signal from axon hillock (black) superimposed with average of nine trials sampled at 10 kHz (red). The filtering effect of sampling at 10 kHz: the peak amplitude underestimated by 3%; the time to reach 50% of maximum amplitude shifted to the left on the time axis by 20 μs.
Figure 4
Figure 4. Spatiotemporal resolution and recording sensitivity
A, fluorescence confocal image of a dye loaded pyramidal neuron with proximal axon in recording position. B, the size and shape of the AP recorded from the soma of layer 5 pyramidal neuron at 32–34°C. C, optical recording of AP related signal from axonal region 4 μm in length indicated by white rectangle in A. Left trace, average of 4 trials. Middle trace, average of 16 trials. Right trace, superimposed upstroke of the two AP signals on expanded time scale. D, first derivative (dV/dt) of the somatic and axonal action potential.
Figure 5
Figure 5. Measurement of the spatial distribution of membrane potential as a function of time along the proximal axon during AP initiation
A, high resolution confocal image of the axon in recording position. B, low spatial resolution fluorescence image of the axon obtained by CCD used for Vm imaging. C, AP signals from 10 locations indicated by yellow rectangles, each 10 μm in length. D, soma–axon latency to 30% (grey) and 50% (black) AP amplitude as a function of distance from the cell body. The first minimum identifies the location and length of the spike TZ. E, time sequence of frames showing spatial profile of colour coded relative Vm amplitude in the axon at four characteristic time points: 0 μs – AP initiation at TZ; 45 μs and 80 μs – invasion of the first node; 240 μs – peak depolarization. F, comparison of AP signals from four characteristic locations on an expanded time scale. The measured data points and cubic spline interpolation curves are shown. Red traces – TZ and first node; green dashed trace – axon hillock; green trace – 1st internodal region. Membrane potential colour scale shown on left.
Figure 6
Figure 6. Increase in sensitivity of optical recording above S/N of ∼7 does not alter the recorded length and location of the spike TZ
A, high resolution confocal image of the axon in recording position. B, spatial profile of colour coded relative Vm amplitude in the axon identifies location and length of the spike TZ at two levels of sensitivity (4 trials averaged; S/N = 7 and 14 trials averaged; S/N = 14). No significant difference was found. Membrane potential colour scale shown on right.
Figure 7
Figure 7. Location and length of the TZ are independent of stimulus duration
A, electrical recordings of APs evoked by short (2 ms) and long (20 ms) current pulse. B, high resolution confocal image of the axon in recording position. Bubles on the axon are artefacts from photo-damage from confocal imaging at the end of experiment. C, spatial profile of colour coded relative Vm amplitude in the axon identifies location and length of the initiation site for APs evoked by short and long depolarizing current pulse. No significant difference was found. Membrane potential colour scale shown on right.
Figure 8
Figure 8. Location and length of the TZ are similar for APs evoked by somatic current pulse and by synaptic stimulation
A, electrical recordings of APs evoked by short current pulse and by synaptic input. B, high resolution confocal image of the axon in recording position. Intracellular stimulating electrode in the soma and extracellular stimulating electrode for localized activation of synapses on basal dendrites are indicated schematically. C, spatial profile of colour coded relative Vm amplitude in the axon identifies the location and length of the initiation site for APs evoked by short depolarizing current pulse and by synaptic stimulation. No significant difference was found. Membrane potential colour scale shown on right.
Figure 9
Figure 9. Spatial pattern of AP initiation and propagation in an individual axon
A, soma–axon latency to 50% AP amplitude as a function of distance from the soma. B, time sequence of frames showing spatial profile of colour coded relative Vm amplitude in the axon at five characteristic points in time: 0 μs – AP initiation at TZ; 30, 60 and 90 μs – invasion of the nodes; 360 μs – the peak depolarization. Membrane potential colour scale shown on right. C,D. Alignment of image of the axon, showing axonal collaterals, and membrane potential changes at spike initiation. Note that each point of issuance of an axon collateral appears functionally to be a node of Ranvier. Grey dot denotes the location of the soma. See Supplementary Movie 1.
Figure 11
Figure 11. The colour coded map of axonal membrane potential plotted as a function of time and space during 1500 μs of AP initiation and propagation
AC, rotation of the 3D plot indicating how the projections in D and E were constructed. D, spike initiation and propagation in a myelinated axon. E, spike initiation and propagation in an unmyelinated axon. Membrane potential colour scale shown on right.
Figure 13
Figure 13. Upper limit in spike discharge frequency
A, fluorescence confocal image of a dye loaded L5 pyramidal neuron; the soma, basal, apical and oblique dendrites, as well as the proximal part of the axon, are clearly visible. Recording sites marked by red rectangles (axon) and blue rectangles (basal dendrite). B, AP signals in response to a pair of depolarizing current pulses delivered to the soma at different frequencies. Both axon and basal dendrite reliably follow instantaneous spiking frequencies of 400 Hz. At 500 Hz the second AP fails to initiate in about 50% of trials. When initiated, the second AP consistently failed in the basal dendrite.
Figure 14
Figure 14. Reliability of AP propagation in the axonal arbour
A, a schematic representation of the axonal arbour reconstructed from a confocal image of a L5 pyramidal neuron loaded with the voltage-sensitive dye. Seven recording locations on the main axon and several collaterals are indicated by blue and red rectangles. B, a typical optical recordings of a train of APs evoked at 400 Hz from multiple locations on the axonal arbour. No evidence for AP failures was found.

References

    1. Antic SD. Action potentials in basal and oblique dendrites of rat neocortical pyramidal neurons. J Physiol. 2003;550:35–50. - PMC - PubMed
    1. Antic S, Zecevic D. Optical signals from neurons with internally applied voltage-sensitive dyes. J Neurosci. 1995;15:1392–1405. - PMC - PubMed
    1. Antic S, Major G, Zecevic D. Fast optical recordings of membrane potential changes from dendrites of pyramidal neurons. J Neurophysiol. 1999;82:1615–1621. - PubMed
    1. Antic S, Wuskell JP, Loew L, Zecevic D. Functional profile of the giant metacerebral neuron of Helix aspersa: temporal and spatial dynamics of electrical activity in situ. J Physiol. 2000;527:55–69. - PMC - PubMed
    1. Binzegger T, Douglas RJ, Martin KA. Axons in cat visual cortex are topologically self-similar. Cereb Cortex. 2004;15:152–165. - PubMed

Publication types

LinkOut - more resources