. 2011 Jul 1;124(Pt 13):2120-31.
doi: 10.1242/jcs.086231.

Mena invasive (MenaINV) promotes multicellular streaming motility and transendothelial migration in a mouse model of breast cancer

Affiliations

Mena invasive (MenaINV) promotes multicellular streaming motility and transendothelial migration in a mouse model of breast cancer

Evanthia T Roussos et al. J Cell Sci. .

Abstract

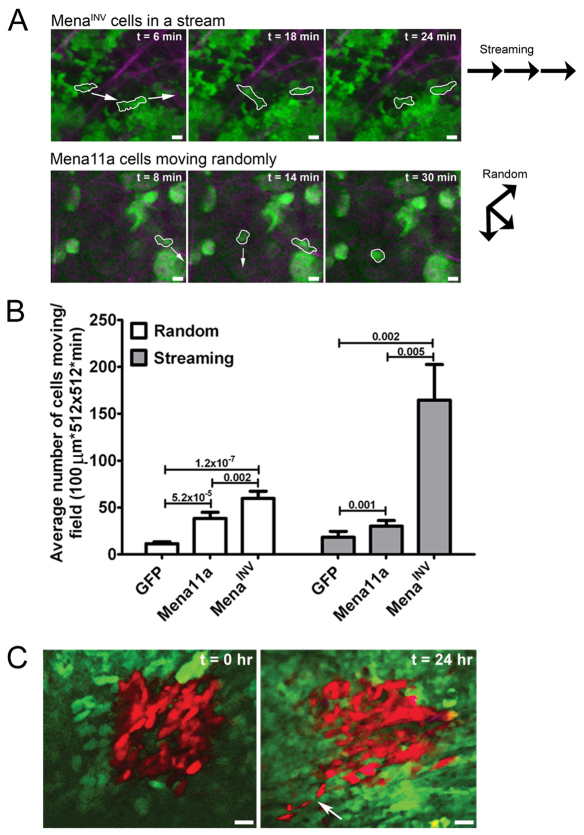
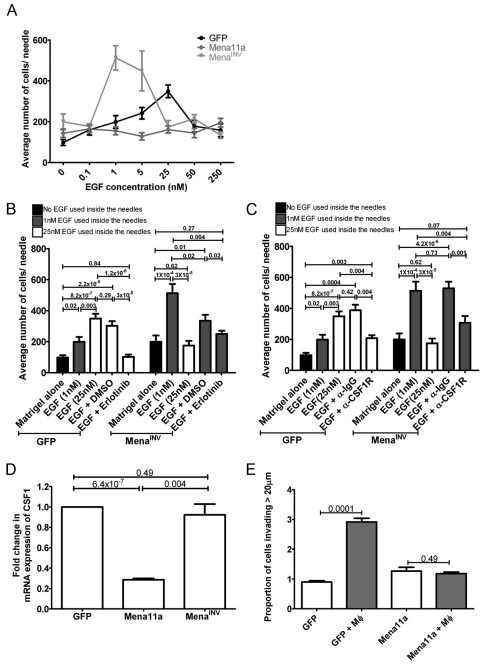
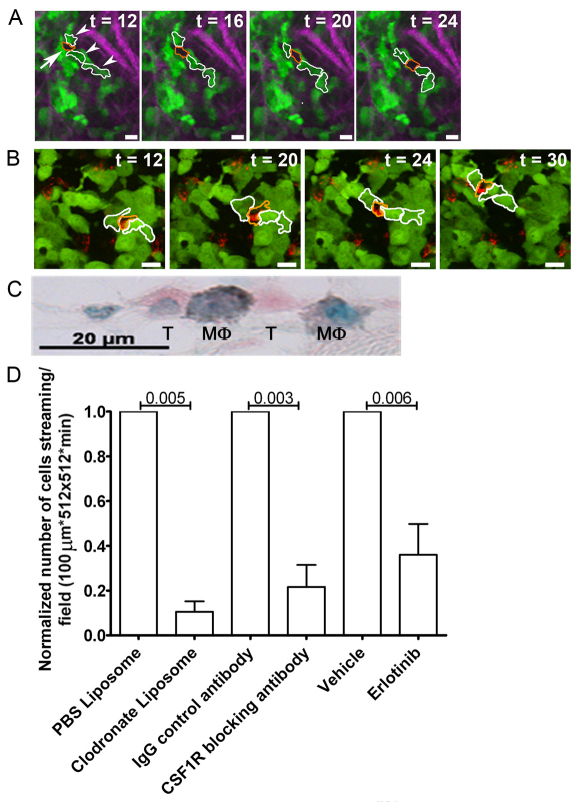
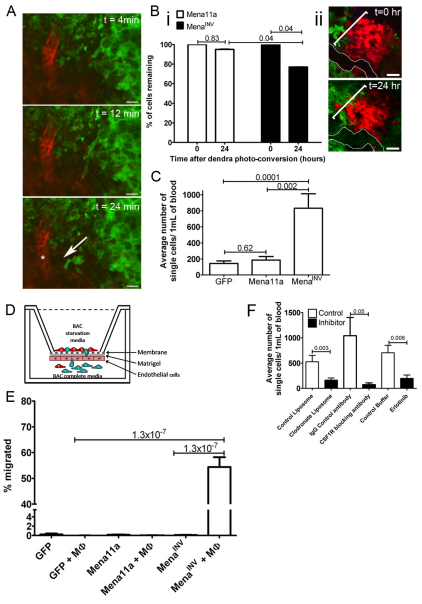
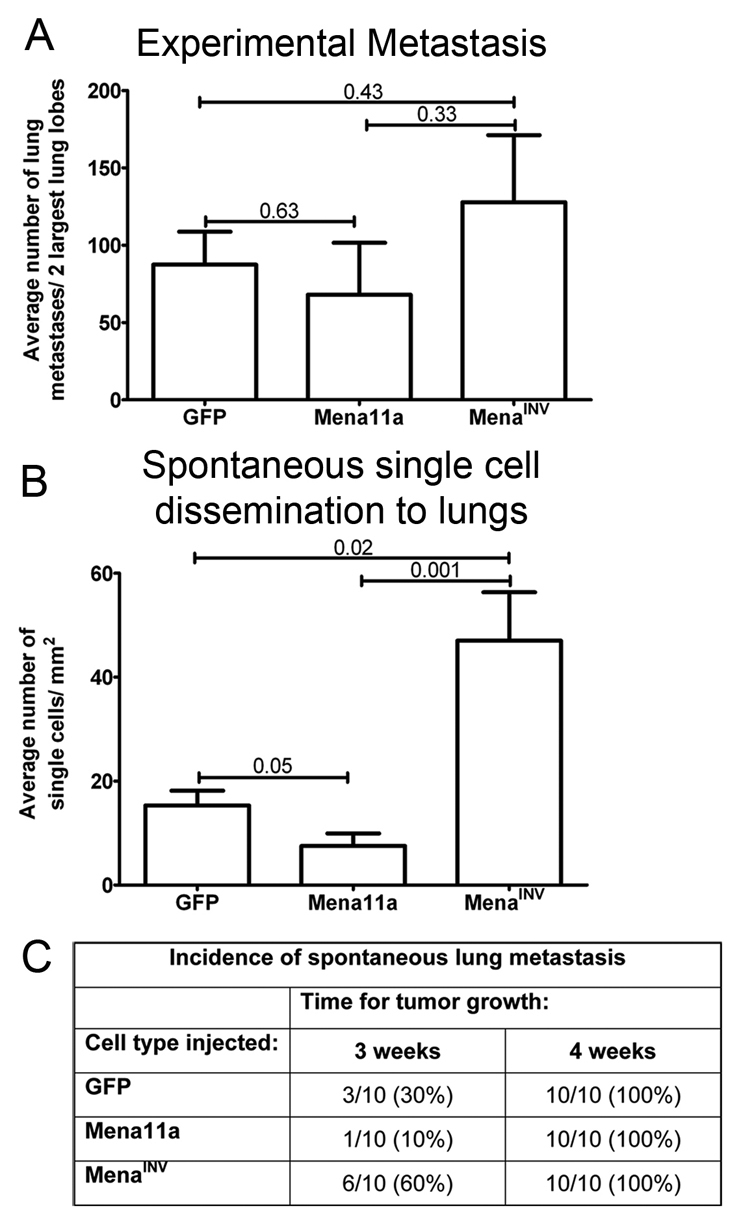
We have shown previously that distinct Mena isoforms are expressed in invasive and migratory tumor cells in vivo and that the invasion isoform (Mena(INV)) potentiates carcinoma cell metastasis in murine models of breast cancer. However, the specific step of metastatic progression affected by this isoform and the effects on metastasis of the Mena11a isoform, expressed in primary tumor cells, are largely unknown. Here, we provide evidence that elevated Mena(INV) increases coordinated streaming motility, and enhances transendothelial migration and intravasation of tumor cells. We demonstrate that promotion of these early stages of metastasis by Mena(INV) is dependent on a macrophage-tumor cell paracrine loop. Our studies also show that increased Mena11a expression correlates with decreased expression of colony-stimulating factor 1 and a dramatically decreased ability to participate in paracrine-mediated invasion and intravasation. Our results illustrate the importance of paracrine-mediated cell streaming and intravasation on tumor cell dissemination, and demonstrate that the relative abundance of Mena(INV) and Mena11a helps to regulate these key stages of metastatic progression in breast cancer cells.


Figures

Fig. 1.
Fig. 1.
MenaINV promotes coordinated carcinoma cell streaming within the primary tumor significantly more than other Mena isoforms. (A) Multiphoton microscopy images (20×) of MenaINV- and Mena11a-expressing mammary tumors in mice. Upper panels illustrate MTLn3–Cerulean–EGFP–MenaINV cells at different intervals in time, moving in a stream; cells outlined in white follow the same path (direction indicated with white arrows in far left panel) as they move through the tumor. Lower panels illustrate MTLn3–Cerulean–EGFP–Mena11a cells at different intervals of time, moving randomly; cells outlined in white are moving in different directions from each other (directions indicated with white arrows in far left and middle panels). Scale bars: 25 μm. Green, Cerulean MTLn3 cells expressing either EGFP–MenaINV or EGFP–Mena11a. Purple, collagen I second harmonic. Vector diagrams to the right illustrate movement patterns of streaming (top vector diagram) versus randomly moving (bottom vector diagram) cells in the panels to the left. Vector diagrams are representative of all cell types participating in either streaming or random movement. (B) Average number of tumors cells moving randomly (white bars) or streaming (gray bars) per field quantified from IVI of primary mammary tumors derived from mammary gland injection of cell types indicated; 30–50 fields analyzed per condition. P values are indicated above bars. Error bars indicate s.e.m. (C) Multiphoton microscopy of MenaINV-expressing MTLn3 tumor cells coexpressing Dendra2 moving coordinately in a cell stream. Images taken at 20× at time 0 (image taken immediately following Dendra2 photoconversion) and 24 hours following Dendra2 photoconversion from green to red. Red area results from the same red photoconverted tumor cells in both images. White arrow, Denra2 photoconverted carcinoma cells in a stream. Green, Dendra2 in MTLn3–MenaINV cells. Scale bars: 50 μm.
Fig. 2.
Fig. 2.
MenaINV and Mena11a have opposite effects on invasion in vivo and in vitro. (A) In vivo invasion assay: EGF dose-response curve of cells collected from primary mammary tumors derived from mammary gland injection of indicated cell types. Values represent averages of 15–25 needles per xenograft model. (B) In vivo invasion in the presence of Erlotinib. Cells were collected from mammary tumors derived from mammary gland injection of each cell type. Bars represent contents of 15–25 needles per xenograft model. (C) In vivo invasion in the presence of CSF1R-blocking antibody (α-CSF1R): Cells collected from mammary tumors derived from mammary gland injection of each cell type. Bars represent contents of 15–25 needles per xenograft model. (D) Real time PCR of cell lines for expression of CSF1. Each bar represents n=3 for three independent experiments. (E) In vitro 3D invasion assay. Proportion of GFP- and Mena11a-expressing cells invading collagen in the absence (white bars) or presence (gray bars) of macrophages. Each bar represents n=3. P values are indicated above bars. Error bars indicate s.e.m.
Fig. 3.
Fig. 3.
Macrophages co-migrate with carcinoma cells during coordinated cell migration as part of the migratory stream. (A) Multiphoton microscopy of carcinoma cells (green cells outlined in white) moving coordinately in a stream with host immune cells (black shadow outlined in orange). Images taken at 20× over 30 minutes. Arrows point to host immune cells. Arrowheads point to carcinoma cells. Green, Cerulean MTLn3 cells expressing EGFP–MenaINV. Purple, collagen I second harmonic. Scale bars: 25 μm. (B) Multiphoton microscopy of carcinoma cells (green cells outlined in white) and Texas Red dextran-labeled macrophages (red cells outlined in orange) moving in a stream. Green, Cerulean MTLn3 cells expressing EGFP–MenaINV. Purple, collagen I second harmonic. Red, Texas Red-labeled dextran. Images taken at 20× over 30 minutes. Scale bars: 25 μm. (C) Immunohistochemistry of EGFP–MenaINV primary tumor section stained for carcinoma cells (pink) and macrophages (gray), imaged at 63×. Pink, EGFP–MenaINV within MTLn3–EGFP–MenaINV cells. Gray, F4/80 within macrophages. Green, nuclear counterstain. (D) Normalized number of cells streaming per field quantified from IVI of primary mammary tumors derived from mammary gland injection of MTLn3–EGFP–MenaINV treated with the indicated reagents; 30–50 fields analyzed per condition. P values indicated above bars. Error bars indicate s.e.m.
Fig. 4.
Fig. 4.
MenaINV cells promote macrophage-dependent transendothelial migration. (A) Multiphoton microscopy of MTLn3–EGFP–MenaINV cells moving towards a blood vessel within the primary mammary tumor of a mouse over 30 minutes. Scale bars: 25 μm. Green, MTLn3–EGFP–MenaINV. Red, Texas Red dextran-labeled blood vessels. White arrow indicates direction of cell movement. Asterisk indicates location of blood vessel. See supplementary material Movie 5. (Bi) Quantification of percentage of Denra2 photoconverted tumor cells remaining in the converted area located near a vessel at 0 and 24 hours. (Bii) Multiphoton microscopy of a primary tumor. Images taken at 20× over 30 minutes. Red area, Dendra2 photoconverted MenaINV tumor cells at 0 and 24 hours. Green, Dendra2–MenaINV tumor cells. White outline, blood vessel. White bracket indicates area evaluated at each time point. Scale bars: 50 μm. (C) Average number of single cells from 1 ml of blood from mice with GFP, MenaINV and Mena11a mammary xenografts; n=10 animals per condition. (D) Cartoon depicting TEM assay. Pink cells, endothelial cells. Solid gray line, Matrigel. Dotted gray line, transwell membrane. Red cells, macrophages (BAC1.2 cells). Green cells, carcinoma cells. (E) Quantification of TEM of each cell type in the absence or presence of macrophages (MΦ); n=3 experiments each done in duplicate. (F) Average number of circulating carcinoma cells in tumors derived from injection of MTLn3–EGFP–MenaINV cells following the indicated treatment; n=10 experiments per condition. P values indicated above bars. Error bars indicate s.e.m.
Fig. 5.
Fig. 5.
MenaINV enhances dissemination of tumor cells and spontaneous metastasis to the lungs. (A) Experimental lung metastasis quantified after intravenous injection of GFP-, Mena11a- or MenaINV-expressing cells showing no statistically significant difference; n=10 animals per cell type. (B) Average number of single tumor cells disseminated into the lungs of mice with GFP, Mena11a or MenaINV mammary xenografts; n=10 animals per condition. (C) Number of animals with spontaneous lung metastases in mice with GFP, Mena11a and MenaINV mammary xenografts following primary tumor growth. P values indicated above bars. Error bars indicate s.e.m.

References

    1. Andresen V., Alexander S., Heupel W. M., Hirschberg M., Hoffman R. M., Friedl P. (2009). Infrared multiphoton microscopy: subcellular-resolved deep tissue imaging. Curr. Opin. Biotechnol. 20, 54-62 - PubMed
    1. Applewhite D. A., Barzik M., Kojima S., Svitkina T. M., Gertler F. B., Borisy G. G. (2007). Ena/VASP proteins have an anti-capping independent function in filopodia formation. Mol. Biol. Cell 18, 2579-2591 - PMC - PubMed
    1. Bailly M., Wyckoff J., Bouzahzah B., Hammerman R., Sylvestre V., Cammer M., Pestell R., Segall J. E. (2000). Epidermal growth factor receptor distribution during chemotactic responses. Mol. Biol. Cell 11, 3873-3883 - PMC - PubMed
    1. Bartocci A., Pollard J. W., Stanley E. R. (1986). Regulation of colony-stimulating factor 1 during pregnancy. J. Exp. Med. 164, 956-961 - PMC - PubMed
    1. Barzik M., Kotova T. I., Higgs H. N., Hazelwood L., Hanein D., Gertler F. B., Schafer D. A. (2005). Ena/VASP proteins enhance actin polymerization in the presence of barbed end capping proteins. J. Biol. Chem. 280, 28653-28662 - PMC - PubMed

Publication types