. 2011 Jul 4;208(7):1485-99.
doi: 10.1084/jem.20100730. Epub 2011 Jun 13.

Foxp3-positive macrophages display immunosuppressive properties and promote tumor growth

Affiliations

Foxp3-positive macrophages display immunosuppressive properties and promote tumor growth

Soraya Zorro Manrique et al. J Exp Med. .

Retraction in

Abstract

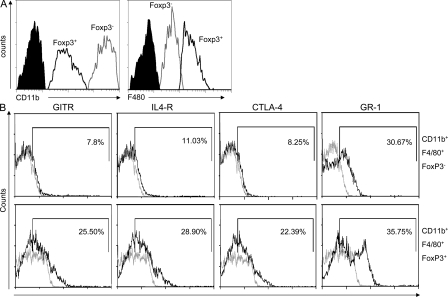
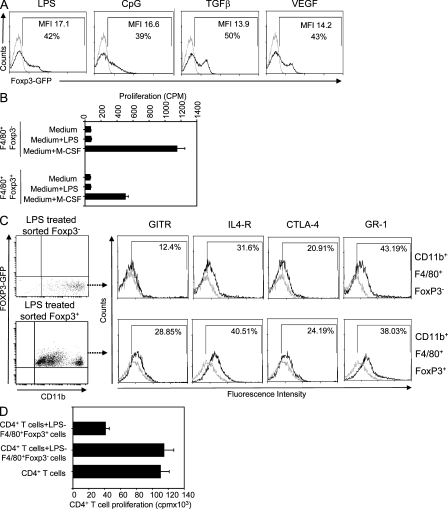
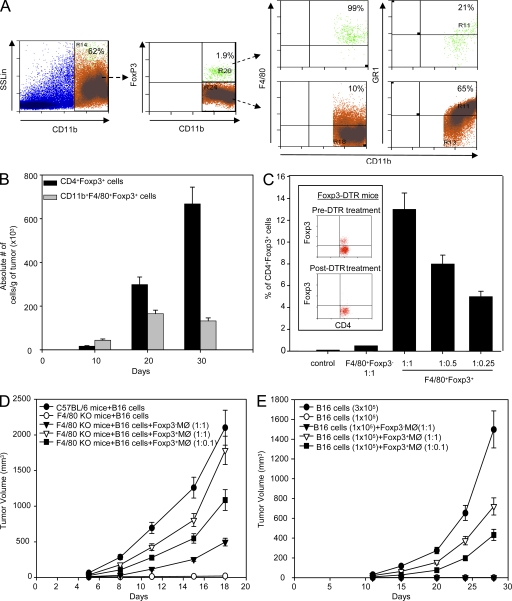
Regulatory T cells (T reg cells) are characterized by the expression of the forkhead lineage-specific transcription factor Foxp3, and their main function is to suppress T cells. While evaluating T reg cells, we identified a population of Foxp3-positive cells that were CD11b(+)F4/80(+)CD68(+), indicating macrophage origin. These cells were observed in spleen, lymph nodes, bone marrow, thymus, liver, and other tissues of naive animals. To characterize this subpopulation of macrophages, we devised a strategy to purify CD11b(+)F4/80(+)Foxp3(+) macrophages using Foxp3-GFP mice. Analysis of CD11b(+)F4/80(+)Foxp3(+) macrophage function indicated that these cells inhibited the proliferation of T cells, whereas Foxp3(-) macrophages did not. Suppression of T cell proliferation was mediated through soluble factors. Foxp3(-) macrophages acquired Foxp3 expression after activation, which conferred inhibitory properties that were indistinguishable from natural Foxp3(+) macrophages. The cytokine and transcriptional profiles of Foxp3(+) macrophages were distinct from those of Foxp3(-) macrophages, indicating that these cells have different biological functions. Functional in vivo analyses indicated that CD11b(+)F4/80(+)Foxp3(+) macrophages are important in tumor promotion and the induction of T reg cell conversion. For the first time, these studies demonstrate the existence of a distinct subpopulation of naturally occurring macrophage regulatory cells in which expression of Foxp3 correlates with suppressive function.


Figures

Figure 1.
Figure 1.
Identification of CD11b+F4/80+Foxp3+ cells. Bone marrow, thymus, spleen, lymph nodes, and liver cells from C57BL/6 mice were stained with anti–CD11b-APC, anti–Foxp3-FITC, anti–F4/80-PE, or anti–CD68-PE. (A) Percentages of double-positive CD11b/Foxp3 cells were determined. (B) CD11b+/Foxp3+-positive cells were gated, and expression of F4/80 and CD68 was determined. (C) Analysis of double-positive CD4/Foxp3, CD8/Foxp3, and CD11c/Foxp3 from spleen cells of C57BL/6 mice. (D) Percentages of double-positive CD11b/Foxp3 cells were determined from bone marrow and spleen cells of RAG-1 KO mice. Positive CD11b+/Foxp3+ cells were gated and expression of F4/80 was determined. All data represent one of at least three separate experiments.
Figure 2.
Figure 2.
Isolation of CD11b+F4/80+Foxp3+ cells from Foxp3-GFP mice. (A) Percentages of double-positive CD11b/GFP(Foxp3) cells and expression of F4/80 and CD68 were determined from bone marrow cells of Foxp3-GFP mice. 10 Foxp3-GFP mice were used to sort sufficient CD11b+F4/80+Foxp3+ cells. Data represent one experiment of at least 10 separate experiments. (B) Bone marrow cells from Foxp3-GFP mice were stained with anti–CD11b-APC and anti–F4/80-PE. Positive CD11b+/F4/80+ cells were gated and first sorted for GFP(Foxp3)+ (85–90% purity) and GFP(Foxp3) (>95% purity) populations. Sorted CD11b+F4/80+Foxp3 and CD11b+F4/80+Foxp3+ were resorted for a second time to enrich the populations, double-sorted GFP(Foxp3)+ (>98% purity), and double-sorted GFP(Foxp3) (100% purity). These levels of purity apply to all the further experiments. Data represent one experiment of at least six separate experiments. (C) Evaluation of Foxp3-mRNA expression from single-sorted F4/80+Foxp3, F4/80+Foxp3+, CD4+Foxp3 (>98% purity), and CD4+Foxp3 (>98% purity) cells. Data represent one experiment of at least five separate experiments. Error bars represent SE.
Figure 3.
Figure 3.
CD11b+F4/80+Foxp3+ cells have characteristics and function of macrophages. (A) Single-sorted F4/80+Foxp3+ and F4/80+Foxp3 cells from bone marrow and CD4+ T cells from spleen were stained with Diff-Quick-Fixative for morphological analysis. The dotted lines indicate cells from different fields of the same smear preparation. Bars, 10 µm. Data represent one experiment of at least five separate experiments. (B) 105 single-sorted F4/80+Foxp3+ and F4/80+Foxp3 cells were incubated with Alexa Fluor 700 beads at a 1:10, 1:25, or 1:50 cell/bead ratio for 4 h (left) or 24 h (right). At the determined times, cells were evaluated for the incorporation of beads by flow cytometry. Data represent one experiment of at least three separate experiments.
Figure 4.
Figure 4.
Phenotypic characterization of CD11b+F4/80+Foxp3+ cells from Foxp3-GFP mice. (A) Expression of CD11b and F4/80 was evaluated from bone marrow–derived double-sorted F4/80+Foxp3+ and F4/80+Foxp3 cells. Data represent one experiment of at least five separate experiments. (B) Double-sorted CD11b+F4/80+Foxp3+ and CD11b+F4/80+Foxp3 cells from spleen were stained using anti–GITR-Biotin, anti–IL-4R-Biotin, anti–CTLA-4-Biotin, and anti–GR-1-Biotin mAb plus Streptavidin–Alexa Fluor 700 (black line). Control antibody, gray line. Data represent one experiment of at least five separate experiments.
Figure 5.
Figure 5.
Evaluation of suppressive function of CD11b+F4/80+Foxp3+ cells. (A) To evaluate the suppressive activity of Foxp3+ and Foxp3 MØ, enriched CD4+ T cells (≥95% purity), and single- or double-sorted F4/80+Foxp3+ and F4/80+Foxp3, cells were co-cultured at a 1:1 ratio and proliferation of CD4+ T cells was measured. As a control, purified CD4+Foxp3+ cells (T reg cells) from Foxp3-GFP mice were mixed at a 1:1 ratio with CD4+ T cells. One of at least five independent experiments is shown. (B) To confirm the suppressive capabilities of Foxp3+ MØ, CD4+ T cells and single- or double-sorted F4/80+Foxp3+ or CD4+Foxp3+ cells (T reg cells) were plated at different effector/suppressor ratios and proliferation of CD4+ T cells was measured. One of at least five independent experiments is shown. (C) CD4+Foxp3 cells (100% purity) were sorted from Foxp3-GFP mice and co-cultured with single-sorted F4/80+Foxp3+ or F4/80+Foxp3 cells at different cell ratios. Proliferation of CD4+ T cells was measured. One of three independent experiments is shown. (D) Depletion of Foxp3 from F4/80+Foxp3+ cells by siRNA. Single-sorted CD11b+F4/80+Foxp3+ cells were transfected with Foxp3-siRNA and mRNA expression of Foxp3 was evaluated. CD4+Foxp3 and CD4+Foxp3+ cells were used as controls for Foxp3 expression. Vertical bars and lanes on the gels correspond to the same conditions. Data represent one experiment of at least three separate experiments. (E) Single-sorted F4/80+Foxp3+ cells were transfected with Foxp3-siRNA or control siRNA. After 48 h, cells were washed, mixed at a 1:1 ratio with CD4+ T cells, and proliferation of CD4+ T cells was measured. One of three independent experiments is shown. Error bars represent SE.
Figure 6.
Figure 6.
CD11b+F4/80+Foxp3+ cells suppress by secretion of soluble factors. (A) Supernatants from cultured single-sorted F4/80+Foxp3+ and F4/80+Foxp3 cells were examined at different dilutions for inhibition of CD4+ T cell proliferation. Data represent one experiment of at least five separate experiments. Error bars represent SE. (B) To identify which factor induces the inhibition of T cell proliferation, supernatants from single-sorted F4/80+Foxp3+ cells were incubated with 10 µg/ml anti–IL-10, anti–TGF-β1, anti–TGF-β2, anti-PGE2 mAb, and isotype control antibody for 2 h before the addition to the cultures. Proliferation of CD4+ T cells was evaluated. Each value represents the mean of triplicate wells ± SE. Proliferation data represent a single experiment of at least three independent experiments. (C) PGE2 secretion was evaluated from supernatants of single-sorted F4/80+Foxp3+ and F4/80+Foxp3 cells. Each value represents the mean of triplicate wells ± SE. (D) To assess whether F4/80+Foxp3+ cells induce suppression by cell–cell contact mechanism, transwell assays were performed. Single-sorted F4/80+Foxp3+ cells were added at indicated ratios to the upper chamber, and purified CD4+ T cells were placed in the bottom chamber and stimulated with anti-CD3/anti-CD28 mAb plus irradiated APCs. Proliferation of CD4+ T cells was evaluated. Each value represents the mean of triplicate wells ± SE. Proliferation data are from a single experiment that is representative of at least three independent experiments.
Figure 7.
Figure 7.
Conversion of CD11b+F4/80+Foxp3 cells. (A) Bone marrow–derived double-sorted F4/80+Foxp3 cells from Foxp3-GFP mice were plated at 5 × 10⁵/well in 24-well plates in the presence of 1 µg/ml LPS, 1 µg/ml CpG, 5 ng/ml TGF-β, and 5 ng/ml VEGF. Cells were cultured for 72 h and the expression of GFP (Foxp3) was analyzed. Untreated CD11b+F4/80+Foxp3 cells, dotted line. Data represent one experiment of at least five separate experiments. (B) Double-sorted F4/80+Foxp3+ and F4/80+Foxp3 cells (105 cells/well) were incubated in complete medium alone, medium plus 1 µg/ml LPS, or medium plus 2 ng/ml M-CSF. Cells were incubated for 3 d and proliferation was measured by 3H-Thymidine incorporation. Each value represents the mean of triplicate wells ± SE. Proliferation data are from a single experiment that is representative of at least three independent experiments. (C) Double-sorted F4/80+Foxp3 cells from Foxp3-GFP mice were treated with 1 µg/ml LPS. After 72 h of incubation, cells were double-sorted into GFP(Foxp3) and GFP(Foxp3)+ cells. Double-sorted cells were evaluated for the level of expression of GR-1, CTLA-4, GITR, and IL-4 (thin line). Control antibody, dotted line. (D) Double-sorted LPS-F4/80+Foxp3 and LPS-F4/80+Foxp3+ cells were plated at a 1:1 ratio with enriched CD4+ T cells and proliferation was measured. Each value represents the mean of triplicate wells ± SE. Proliferation data are from a single experiment that is representative of at least three independent experiments.
Figure 8.
Figure 8.
Global transcriptional analysis of CD11b+F4/80+Foxp3 and CD11b+F4/80+Foxp3+ cells. Heat maps showing five groups of gene categories derived from significantly enriched pathways (P < 0.001), illustrating major differences in gene expression levels between double-sorted F4/80+Foxp3+ and double-sorted F4/80+Foxp3 cells. All genes are significantly (P = 0.05) differentially expressed with greater than or equal to twofold change. The color bar shows ranges from −4 to +4 on a log2 scale.
Figure 9.
Figure 9.
Analysis of cytokine profiles of CD11b+F4/80+Foxp3+ and CD11b+F4/80+Foxp3 cells. (A) The level of Arginase 1 and iNOS expression (thin line) in single-sorted F4/80+Foxp3 and F4/80+Foxp3+ cells was evaluated by flow cytometry. Control antibody, dotted line. Data represent one experiment of at least three separate experiments. (B) Single-sorted F4/80+Foxp3+ and F4/80+Foxp3 cells were cultured for 3 d in complete medium supernatants collected and the levels of cytokines, chemokines, and growth factors were analyzed by multiplex assay. Each value represents the mean of triplicate wells ± SE.
Figure 10.
Figure 10.
CD11b+F4/80+Foxp3+ cells promote tumor growth. (A) A 30-d-old B16 tumor was stained with anti–CD11b-APC, anti–Foxp3-FITC, and anti–F4/80-PE or anti–GR1-PE mAb. CD11b+ cells were gated and percentages of CD11b+Foxp3+ cells were determined. Percentages of double-positive CD11b/F4/80 or CD11b/GR-1 cell were determined from the gated CD11b+/Foxp3+ cells and CD11b+/Foxp3 cells. Data shown are from a single experiment that is representative of at least three independent experiments. (B) C57BL/6 mice were inoculated with 1 × 10⁶ B16 cells and animals were sacrificed on day 10, 20, or 30. The absolute numbers of CD11b+F4/80+Foxp3+ and CD4+Foxp3+ cells within the tumor was evaluated. Five animals were included per group. Data are representative of two experiments. (C) Foxp3-DTR mice were treated with 50 mg/kg DT for 2 d. On day 3, animals were sacrificed. With this protocol, >99% of the T reg cells were depleted in spleen (inset). After treatment, CD4+Foxp3 cells from Foxp3-DTR mice were sorted and plated on plates coated with anti-CD3 antibody and anti-CD28 antibody and co-cultured in the presence of double-sorted F4/80+Foxp3 or F4/80+Foxp3+ cells at different CD4+Foxp3 cell to F4/80+Foxp3−/+ cell ratios. After 3 d of incubation, percentages of converted CD4+Foxp3+ were analyzed. One of at least three independent experiments is shown. (D) C57BL/6 and F4/80 KO mice were implanted with 1 × 10⁶ B16 cells. Single-sorted CD11b+F4/80+Foxp3+ cells from Foxp3-GFP mice (106 or 105) were mixed with B16 cells (106) and implanted s.c. into F4/80 KO mice and tumor growth was analyzed. In the control F4/80 KO group, mice were implanted with a mixture of 106 B16 cells and 106 single-sorted CD11b+F4/80+Foxp3 cells and tumor growth was evaluated. Five animals were included per group. Data are representative of two experiments. (E) 105 single-sorted F4/80+Foxp3± or 104 single-sorted F4/80+Foxp3+ cells from Foxp3-GFP mice, mixed with 105 B16 cells, were implanted s.c. into C57BL/6 mice and tumor growth was analyzed. As a control for tumor growth, C57BL/6 mice were implanted with 3 × 10⁵ B16 cells. Five animals were included per group. Data are representative of two experiments. Error bars represent SE.

Comment in

References

    1. Allavena P., Sica A., Garlanda C., Mantovani A. 2008. The Yin-Yang of tumor-associated macrophages in neoplastic progression and immune surveillance. Immunol. Rev. 222:155–161 10.1111/j.1600-065X.2008.00607.x - DOI - PubMed
    1. Amatschek S., Lucas R., Eger A., Pflueger M., Hundsberger H., Knoll C., Grosse-Kracht S., Schuett W., Koszik F., Maurer D., Wiesner C. 2011. CXCL9 induces chemotaxis, chemorepulsion and endothelial barrier disruption through CXCR3-mediated activation of melanoma cells. Br. J. Cancer. 104:469–479 10.1038/sj.bjc.6606056 - DOI - PMC - PubMed
    1. Apolloni E., Bronte V., Mazzoni A., Serafini P., Cabrelle A., Segal D.M., Young H.A., Zanovello P. 2000. Immortalized myeloid suppressor cells trigger apoptosis in antigen-activated T lymphocytes. J. Immunol. 165:6723–6730 - PubMed
    1. Bacchetta R., Passerini L., Gambineri E., Dai M., Allan S.E., Perroni L., Dagna-Bricarelli F., Sartirana C., Matthes-Martin S., Lawitschka A., et al. 2006. Defective regulatory and effector T cell functions in patients with FOXP3 mutations. J. Clin. Invest. 116:1713–1722 10.1172/JCI25112 - DOI - PMC - PubMed
    1. Belkaid Y. 2007. Regulatory T cells and infection: a dangerous necessity. Nat. Rev. Immunol. 7:875–888 10.1038/nri2189 - DOI - PubMed

Publication types

MeSH terms