. 2011 Jun 28;108(26):10708-13.
doi: 10.1073/pnas.1107297108. Epub 2011 Jun 13.

Beta oscillations in the monkey sensorimotor network reflect somatosensory decision making

Affiliations

Beta oscillations in the monkey sensorimotor network reflect somatosensory decision making

Saskia Haegens et al. Proc Natl Acad Sci U S A. .

Abstract

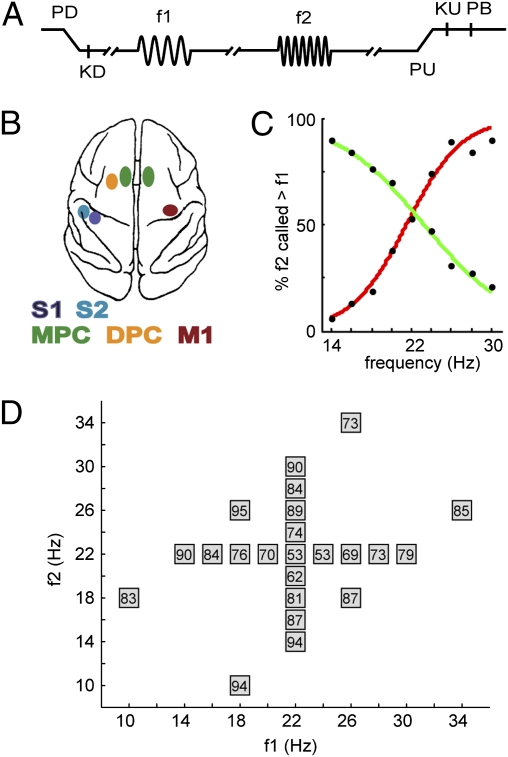
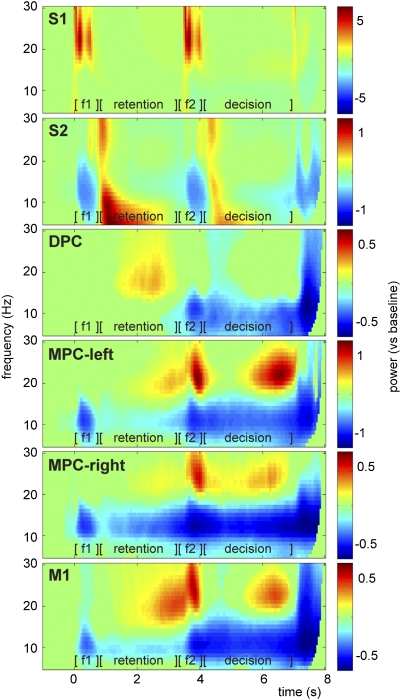
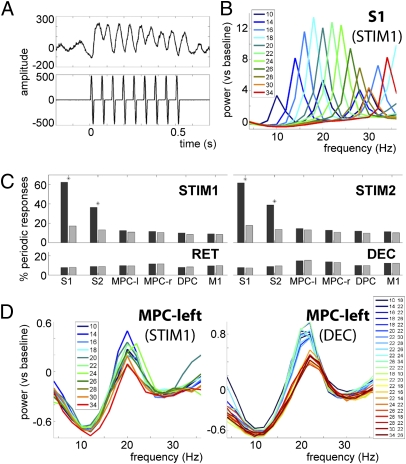
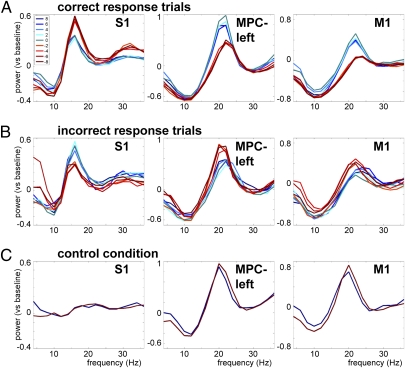
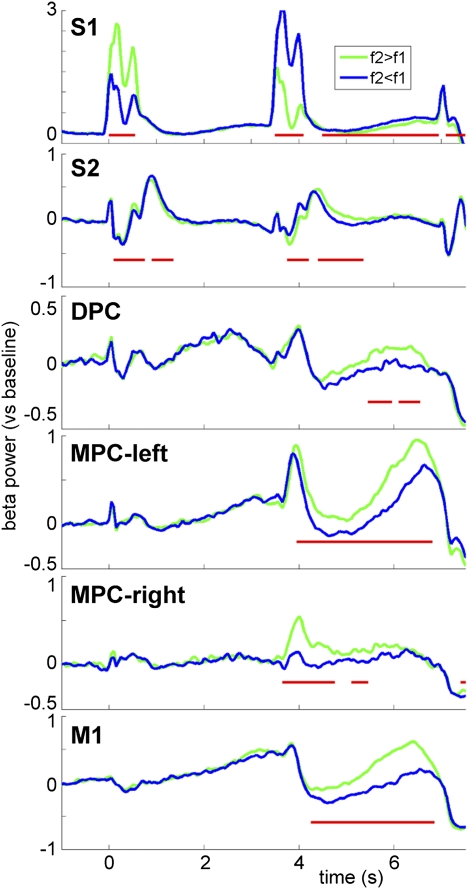
The neuronal correlate of perceptual decision making has been extensively studied in the monkey somatosensory system by using a vibrotactile discrimination task, showing that stimulus encoding, retention, and comparison are widely distributed across cortical areas. However, from a network perspective, it is not known what role oscillations play in this task. We recorded local field potentials (LFPs) from diverse cortical areas of the sensorimotor system while one monkey performed the vibrotactile discrimination task. Exclusively during stimulus presentation, a periodic response reflecting the stimulus frequency was observed in the somatosensory regions, suggesting that after initial processing, the frequency content of the stimulus is coded in some other way than entrainment. Interestingly, we found that oscillatory activity in the beta band reflected the dynamics of decision making in the monkey sensorimotor network. During the comparison and decision period, beta activity showed a categorical response that reflected the decision of the monkey and distinguished correct from incorrect responses. Importantly, this differential activity was absent in a control condition that involved the same stimulation and response but no decision making required, suggesting it does not merely reflect the maintenance of a motor plan. We conclude that beta band oscillations reflect the temporal and spatial dynamics of the accumulation and processing of evidence in the sensorimotor network leading to the decision outcome.


Conflict of interest statement

The authors declare no conflict of interest.

Figures

Fig. 1.
Fig. 1.
Somatosensory discrimination task. (A) Sequence of events: Mechanical probe is lowered (PD), monkey places response hand on key (KD), after a variable prestimulus delay first vibrotactile stimulus is presented (f1), after a 3-s fixed delay the second stimulus is presented (f2), after another 3-s fixed delay the probe is lifted (PU), the monkey releases the key (KU), and pushes either a lateral or medial button (PB) to indicate whether f2 was of higher or lower frequency than f1, respectively. The monkey was rewarded with a drop of liquid for correct discriminations. (B) Overview of recording sites. During each recording session, up to seven electrodes were individually placed in each of five cortical regions: S1, S2, DPC, MPC, and M1. (C) Psychometric curves showing the percentage of trials in which f2 was assessed as higher than f1, when f1 was maintained at 22 Hz and f2 was variable (red curve), and when f2 was maintained at 22 Hz and f1 was variable (green curve). The varied stimulus frequency is presented on the x axis. (D) Stimulus set used during recordings. Each box represents a stimulus pair and shows the percentage of correct responses for the comparison of that pair.
Fig. 2.
Fig. 2.
Oscillatory activity in the LFPs during the somatosensory discrimination task. Time-frequency representations showing oscillatory activity in alpha (8–14 Hz) and beta (15–30 Hz) band related to different aspects of the discrimination task. Presentation of first stimulus (f1, t = 0–0.5 s), retention period (t = 0.5–3.5 s), presentation of second stimulus (f2, t = 3.5–4 s), and decision period (t = 4–7 s), followed by the delayed motor response. Showing significant power modulations only (tested vs. baseline activity with cluster-based permutation statistics, P < 0.05), averaged over all recording sessions and channels within each region. S1, S2, DPC, and MPC-left were recorded contralateral to the stimulated hand; MPC-right and M1 were recorded contralateral to the response hand.
Fig. 3.
Fig. 3.
Periodic stimulus response in somatosensory regions. (A) Trace of single-trial LFPs during stimulus presentation (t = 0–0.5 s), recorded with one electrode in S1 (Upper) and the respective stimulus (16 Hz) as recorded from the trigger channel (Lower). (B) Power spectrum during stimulus presentation in S1, sorted by stimulus frequency. The peak frequencies exactly reflect the actual stimulus frequencies (averaged over trials). (C) S1 and S2 showed a significant periodic response to the stimulus (P < 0.05, Bonferroni corrected for multiple comparisons, denoted by *). The analysis was performed for the stimulus windows (STIM1, t = 0–0.5; STIM2, t = 3.5–4), and the delay windows (RET, t = 0.5–3.5 s; DEC, t = 4–7), contrasting experimental data (dark gray bars) with randomized data (light gray bars). (D) Power spectra during stimulus presentation (Left) and decision period (Right) in MPC-left, sorted by stimulus frequency. During the decision period, the beta band activity is modulated in a categorical fashion, reflecting the two decision outcomes (i.e., f2 > f1, blue traces, vs. f2< f1, red traces).
Fig. 4.
Fig. 4.
Beta power reflects decision and predicts mistakes. (A) Power spectra during the decision period for correct response trials in S1 (Left), MPC-left (Center) and M1 (Right), sorted by the difference between f2 and f1 (blue traces: f2 > f1; red traces: f2 < f1). (B and C) Same as A but for incorrect response trials (B) and the control condition (C).
Fig. 5.
Fig. 5.
Beta power time courses reflect decision dynamics. Time courses of beta power (S1: 12–20 Hz; all other regions: 18–26 Hz) for each region separately. Trials (correct responses only) were averaged according to the outcome of the comparison of f2 and f1 (green traces: f2 > f1; blue traces: f2 < f1). Significant differences between the two traces are indicated by a red line (cluster-based permutation test, P < 0.05).

References

    1. Romo R, Salinas E. Flutter discrimination: Neural codes, perception, memory and decision making. Nat Rev Neurosci. 2003;4:203–218. - PubMed
    1. Hernández A, et al. Decoding a perceptual decision process across cortex. Neuron. 2010;66:300–314. - PubMed
    1. Lemus L, et al. Neural correlates of a postponed decision report. Proc Natl Acad Sci USA. 2007;104:17174–17179. - PMC - PubMed
    1. Hernández A, Salinas E, García R, Romo R. Discrimination in the sense of flutter: New psychophysical measurements in monkeys. J Neurosci. 1997;17:6391–6400. - PMC - PubMed
    1. Hernández A, Zainos A, Romo R. Temporal evolution of a decision-making process in medial premotor cortex. Neuron. 2002;33:959–972. - PubMed

Publication types

LinkOut - more resources