. 2011 Jul;121(7):2833-44.
doi: 10.1172/JCI43578. Epub 2011 Jun 13.

Progerin and telomere dysfunction collaborate to trigger cellular senescence in normal human fibroblasts

Affiliations

Progerin and telomere dysfunction collaborate to trigger cellular senescence in normal human fibroblasts

Kan Cao et al. J Clin Invest. 2011 Jul.

Abstract

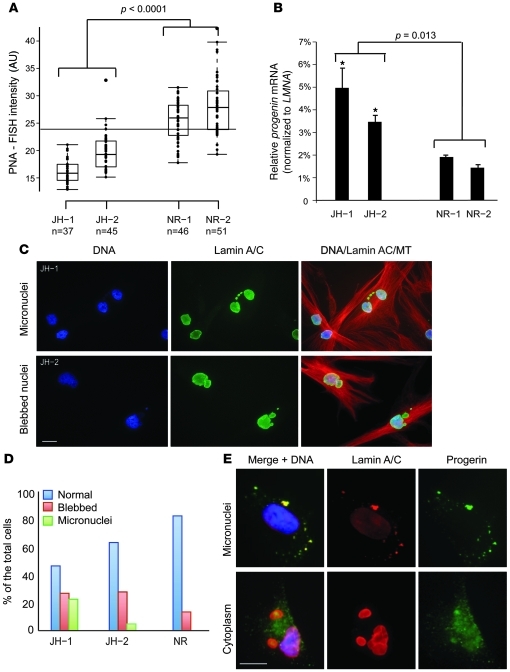
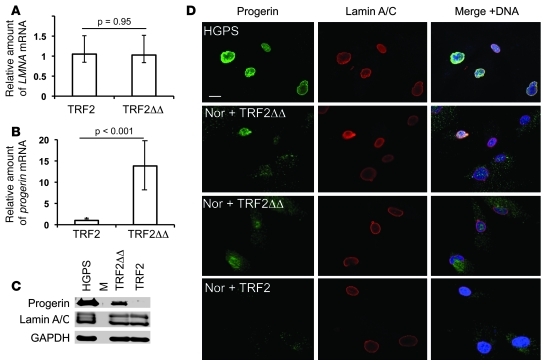
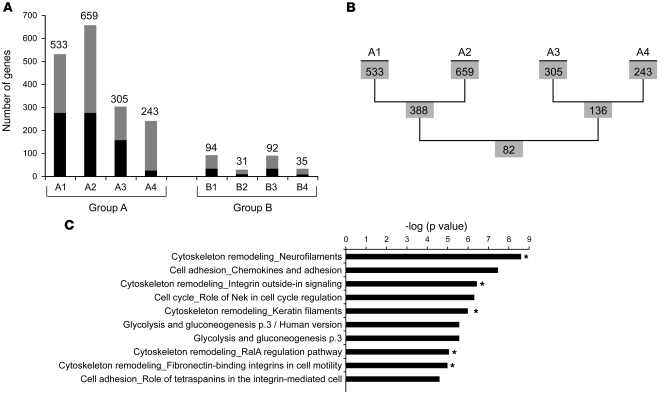
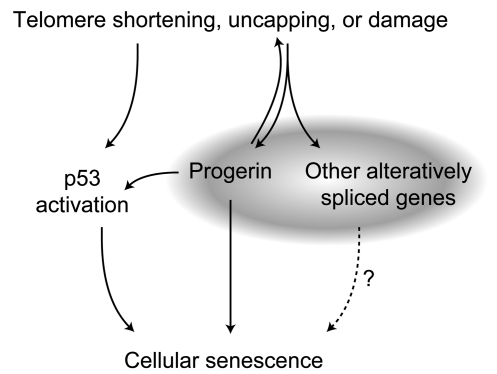
Hutchinson-Gilford progeria syndrome (HGPS), a devastating premature aging disease, is caused by a point mutation in the lamin A gene (LMNA). This mutation constitutively activates a cryptic splice donor site, resulting in a mutant lamin A protein known as progerin. Recent studies have demonstrated that progerin is also produced at low levels in normal human cells and tissues. However, the cause-and-effect relationship between normal aging and progerin production in normal individuals has not yet been determined. In this study, we have shown in normal human fibroblasts that progressive telomere damage during cellular senescence plays a causative role in activating progerin production. Progressive telomere damage was also found to lead to extensive changes in alternative splicing in multiple other genes. Interestingly, elevated progerin production was not seen during cellular senescence that does not entail telomere shortening. Taken together, our results suggest a synergistic relationship between telomere dysfunction and progerin production during the induction of cell senescence, providing mechanistic insight into how progerin may participate in the normal aging process.


Figures

Figure 1
Figure 1. Cellular senescence activates progerin transcription.
(A) Schematic representation of the double-color progerin splicing reporter construct. The cryptic splice site is shown as a solid box in exon 11. (B) FACS analysis of fibroblasts from a normal individual (AG06299) transiently transfected with buffer (Negative), the pIRES-DsRed-Expression 2 vector (DsRed only), the pEGFP-N1 vector (GFP only), or the progerin splicing reporter construct (Sample). (C) The percentage of cells with activation of the progerin splicing site increased with the number of cell passages. Results from a fibroblast line derived from a normal individual (AG06299) are shown.
Figure 2
Figure 2. Progerin-expressing cells from normal individuals show signs of senescence.
(A) An example of the quantitative telomere PNA-FISH analysis of a normal fibroblast cell (HGFDFN168). DNA was stained with DAPI in blue to show the boundary of the nucleus (outlines), and telomere-FISH signals are in red. Scale bar: 5 μm. (B) Box plot representation of the absolute fluorescence intensity of the telomere-FISH in double-positive (n = 26) and DsRed-only (n = 28) cells. Each dot represents the absolute fluorescence intensity in 1 tested cell. Box denotes 25th and 75th percentiles; line within box denotes 50th percentile; whiskers denote 9th and 91st percentiles. P < 0.0001, double-positive vs. DsRed-only.
Figure 3
Figure 3. Immortalized cells suppress progerin transcription.
(A) Schematic representation of the positions of progerin- or lamin A– specific primers used for RT-PCR analysis. (B) qRT-PCR. Primary lines included normal fibroblast cell lines HGFDFN168 and HGFDFN090 (Fb1 and Fb2, respectively); human aortic SMC line; and B lymphocyte lines AG09393 and AG11659 (BL1 and BL2, respectively). HGPS fibroblast lines were HGADFN167 and HGADFN003 (HGPS1 and HGPS2, respectively). 4 immortalized lines of indicated cell types are also shown. qRT-PCR showed more progerin mRNA than LMNA mRNA in HGPS cell lines, which was an artifact caused by the difference in priming efficiency of progerin-and lamin A–specific primers (see Supplemental Figure 4C). (C) Representative images of quantitative telomere PNA-FISH analysis of human TERT–immortalized (+TERT) and primary (–TERT) fibroblast cells (AG09838, p8). DNA was stained with DAPI in blue to show the boundary of the nucleus (outlines), and telomere-FISH signals are in green. (D) qRT-PCR analysis of the total progerin mRNA amount in normal and human TERT–immortalized cell lines with progerin-specific primers. The relative expression values for progerin were normalized to the mean values of endogenous LMNA. HeLa and 293T lines are shown as controls.
Figure 4
Figure 4. Progerin production is not increased in oncogene ras–induced premature cellular senescence.
(A) Vector control and H-rasV12–infected AG08470 cells stained for SA–β-gal activity at day 6 after puromycin selection. (B) Box plot representation of the quantitative telomere PNA-FISH in the vector control or H-rasV12 transfected AG08470 cells (P = 0.138; n = 22 per group). Box denotes 25th and 75th percentiles; line within box denotes 50th percentile; whiskers denote 9th and 91st percentiles. (C) qRT-PCR analysis of total progerin mRNA in H-rasV12– or control-infected normal fibroblast cells with progerin-specific primers. Relative expression values for progerin were normalized to the mean values of endogenous LMNA. Fb1 and Fb2, replicates performed in AG08470 and HGFDFN168, respectively, at p14.
Figure 5
Figure 5. Progerin production is more abundant in passage-matched DC fibroblasts that carry a TERT mutation.
(A) Box plot representation of the quantitative telomere PNA-FISH in JH-1 and JH-2. JH-1 and JH-2 had significantly shorter telomeres compared with passage-matched normal fibroblast controls (P < 0.0001). All cell lines were analyzed at p12–p15. NR1 and NR2, normal fibroblast controls HGFDFN168 and HGFDFN090, respectively, at p14. n is indicated for each group. Box denotes 25th and 75th percentiles; line within box denotes 50th percentile; whiskers denote 9th and 91st percentiles. (B) qRT-PCR analysis of progerin mRNA in JH-1 and JH-2 cells. The relative expression values for progerin were normalized to the mean values of LMNA. Significantly greater amounts of progerin were observed in p12 JH-1 and p15 JH-2 cells, which have accelerated telomere shortening (P = 0.013, p12 JH-1 and p15 JH-2 vs. p14 NR-1 and p14 NR-2). (C) Immunofluorescence of JH-1 and JH-2 fibroblast cells with anti-lamin A/C antibody (green) and anti–α-tubulin (MT; red) antibody. DNA is labeled with DAPI in blue. (D) Quantification of nuclear blebbing and micronuclei in p12 JH-1 and p15 JH-2 cells. A normal fibroblast (NR; AG08470 at p14) was used as a control. (E) Immunostaining with anti-progerin antibody in selected DC cells. DNA is stained with DAPI in blue. Scale bar: 10 μm.
Figure 6
Figure 6. Progerin production is upregulated in cells with uncapped telomeres.
(A and B) qRT-PCR analysis of TRF2 and TRF2ΔBΔM (TRF2ΔΔ) cells with the progerin- or lamin A–specific primer pairs. Amounts of progerin (B) and LMNA (A) relative to ACTB are shown. (C) Western blotting analysis of progerin amount in normal fibroblasts infected with WT TRF2 or TRF2ΔBΔM. M, marker lane. (D) Immunofluorescence with anti-lamin A/C antibody (red) and anti-progerin (green) antibody. Nor, normal human fibroblasts. Scale bar: 10 μm.
Figure 7
Figure 7. Extensive alterations in alternative splicing occur as cells senesce.
(A) Number of genes that showed significant changes in alternative splicing in each indicated comparison. Gray, genes that exhibited changes only in alternative splicing; black, genes that exhibited changes both in alternative splicing and in gene expression. Group A included binary comparisons between normal fibroblasts before and after senescence: A1, p34 vs. p52 for normal fibroblast AG06299; A2, p7 vs. p22 for normal fibroblast HGFDFN168; A3, normal vs. human TERT–immortalized fibroblast HGFDFN090 at p6; A4, human TERT–immortalized vs. nonimmortalized normal fibroblast AG08398 at p8. Group B compared passage-matched fibroblasts where no significant variations in telomere length are present: B1, HGPS fibroblast HGADFN167 at p15 vs. HGPS fibroblast HGADFN003 at p16; B2, normal fibroblast HGFDFN168 at p14 vs. normal fibroblast HGFDFN090 at p14; B3, HGPS fibroblast HGADFN167 at p15 vs. age-matched normal fibroblast AG08470 at p14; B4, HGPS fibroblast HGADFN003 at p16 vs. age-matched normal fibroblast AG08470 at p14. (B) There were 82 overlapping genes among the 4 lists of genes in group A. (C) GO analysis (sorted by process networks) of the 82 overlapping genes in B. The top 10 enriched categories are shown; cytoskeleton-related categories are denoted with asterisks.
Figure 8
Figure 8. Proposed model of senescence.
Previous work has shown that dysfunctional telomeres activate p53; apparently, so does progerin in HGPS cells. However, as shown in the present study, telomere shortening, uncapping, or damage in normal cells also triggers alternative splicing of a suite of genes, including production of progerin mRNA and progerin protein. These changes, in turn, may make a significant contribution to cellular senescence. The very recent report from Benson et al. (47) suggests that the signaling from telomeres to progerin may represent a bidirectional prosenescence feedback loop.

References

    1. Hayflick L. Intracellular determinants of cell aging. Mech Ageing Dev. 1984;28(2–3):177–185. doi: 10.1016/0047-6374(84)90018-6. - DOI - PubMed
    1. Jeyapalan JC, Sedivy JM. Cellular senescence and organismal aging. Mech Ageing Dev. 2008;129(7–8):467–474. doi: 10.1016/j.mad.2008.04.001. - DOI - PMC - PubMed
    1. Olovnikov AM. Telomeres, telomerase, and aging: origin of the theory. Exp Gerontol. 1996;31(4):443–448. doi: 10.1016/0531-5565(96)00005-8. - DOI - PubMed
    1. de Lange T. Shelterin: the protein complex that shapes and safeguards human telomeres. Genes Dev. 2005;19(18):2100–2110. doi: 10.1101/gad.1346005. - DOI - PubMed
    1. Harley CB, Futcher AB, Greider CW. Telomeres shorten during ageing of human fibroblasts. Nature. 1990;345(6274):458–460. doi: 10.1038/345458a0. - DOI - PubMed

Publication types