. 2012 Apr;132(2):523-35.
doi: 10.1007/s10549-011-1619-7. Epub 2011 Jun 14.

Genomic analysis identifies unique signatures predictive of brain, lung, and liver relapse

Affiliations

Genomic analysis identifies unique signatures predictive of brain, lung, and liver relapse

J Chuck Harrell et al. Breast Cancer Res Treat. 2012 Apr.

Abstract

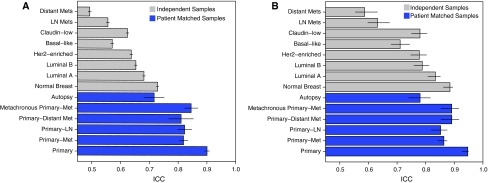
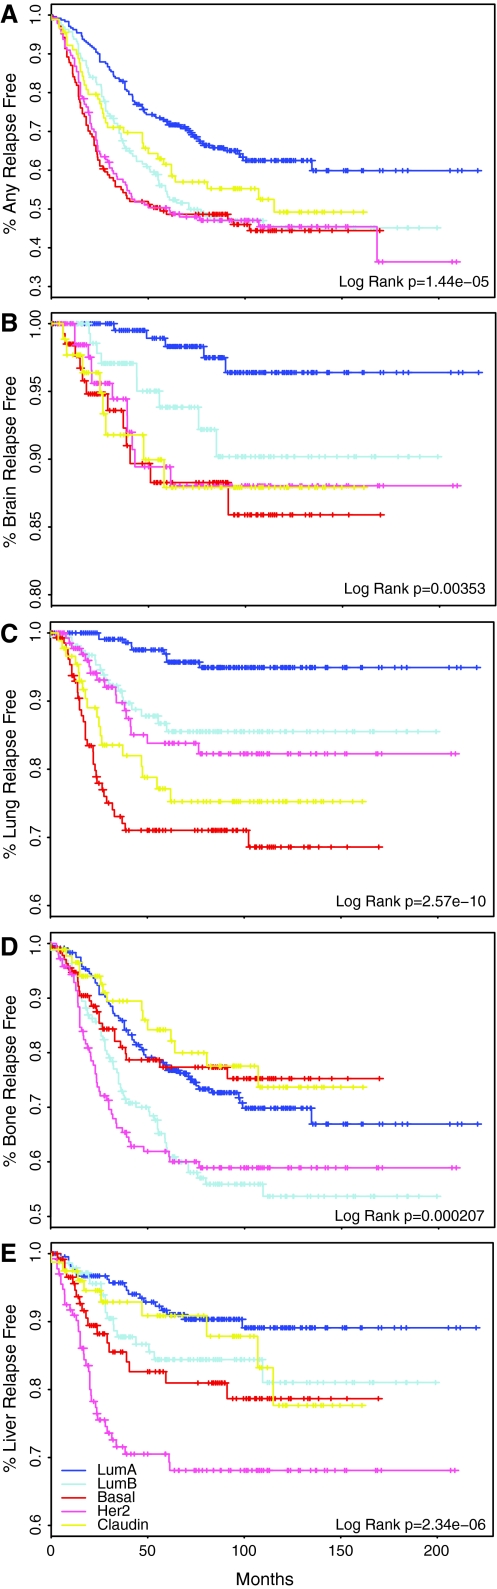
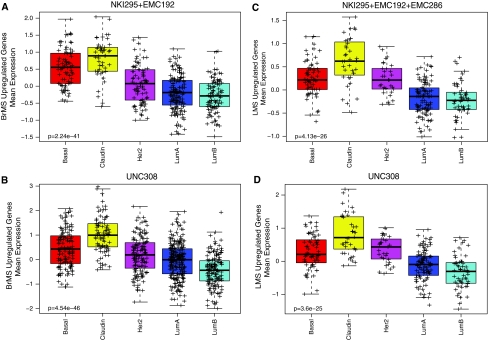
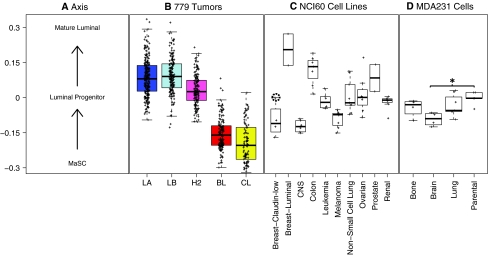
The ability to predict metastatic potential could be of great clinical importance, however, it is uncertain if predicting metastasis to specific vital organs is feasible. As a first step in evaluating metastatic predictions, we analyzed multiple primary tumors and metastasis pairs and determined that >90% of 298 gene expression signatures were found to be similarly expressed between matched pairs of tumors and metastases; therefore, primary tumors may be a good predictor of metastatic propensity. Next, using a dataset of >1,000 human breast tumor gene expression microarrays we determined that HER2-enriched subtype tumors aggressively spread to the liver, while basal-like and claudin-low subtypes colonize the brain and lung. Correspondingly, brain and lung metastasis signatures, along with embryonic stem cell, tumor initiating cell, and hypoxia signatures, were also strongly expressed in the basal-like and claudin-low tumors. Interestingly, low "Differentiation Scores," or high expression of the aforementioned signatures, further predicted for brain and lung metastases. In total, these data identify that depending upon the organ of relapse, a combination of gene expression signatures most accurately predicts metastatic behavior.


Figures

Fig. 1
Fig. 1
Genomic similarity of breast tumors and metastases. Microarrays were performed on 265 primary tumors and 85 metastases and the overall similarity was measured by intra-class correlation (ICC), with estimates plotted showing 95% confidence intervals. a Using all variably expressed genes, gene expression concordance values were measured in matched samples from the same patient; primary tumors split in 2 (n = 40), tumor-metastasis pairs (n = 34), tumor–LN metastasis pairs (n = 24), tumor-distant metastasis (n = 10), autopsy patient metastases from multiple organs within the same patient (n = 33), metachronous tumor–metastasis pairs (n = 10), or from independent patient samples; normal breast (n = 17), luminal A tumors (n = 86), luminal B tumors (n = 50), HER2-enriched tumors (n = 25), basal-like tumors (n = 44), claudin-low tumors (n = 45), LN metastases (n = 21), and distant metastases (n = 45). b ICC of 298 gene expression signatures/modules [12] using the same samples and pairing used in (a)
Fig. 2
Fig. 2
Association of breast cancer subtype with site of first relapse. Shown are Kaplan–Meier plots and log rank tests of first site of relapse in each breast tumor subtype in the 779 tumor dataset. If a patient showed two or more simultaneous sites of relapse, then this patient was counted as being site of first relapse for both. Organ of first relapse; a any, b brain, c lung, d bone, e liver
Fig. 3
Fig. 3
Association of the brain (BrMS) and lung (LMS) cell line-based metastasis signatures with intrinsic subtype. Box-and-whisker plots are shown for each signature on multiple breast tumor microarray data sets according to intrinsic subtype. P values were calculated with ANOVA. Shown are the same data sets used for the testing of the BrMS (a) or LMS (c) signatures, as well as an independent UNC dataset (b, d)
Fig. 4
Fig. 4
Differentiation Score analysis of the 779 human breast tumors, NCI60 cell lines, and MDA-MB-231 cell lines. a Differentiation axis diagram based on FACS fractions Lim et al. [8], which is described in Prat et al. [6]. bBox-and-whisker plots of the distributions of scores from the 779 tumor dataset according to intrinsic subtype. c NCI60 cancer cell lines gene DS values [21], with the breast cancer cell lines divided into claudin-low (dashed circle value for MDA-MB-231) or luminal cell lines. d MDA-MB-231 parental, lung-tropic, brain-tropic, and bone-tropic cell lines from the studies of Massagué and colleagues. The asterisk indicates statistical significance difference in DS between parental and brain-tropic lines (T test P = 0.002)
Fig. 5
Fig. 5
Relationship of Differentiation Score, breast cancer subtype, and likelihood of site of metastasis. 779 tumors with known first site of relapse were ordered based on low to high DS. a Hazard ratios for each site of metastasis were estimated by grouping a sliding window of 50 samples with consecutive DS and contrasting against those outside the window. Estimates were then smoothed with Lowess prior to plotting. b Hierarchical clustering of all genes. Below the dendogram is a colored bar identifying the intrinsic subtype of each tumor (yellow claudin-low, red basal-like, pink HER2-enriched, dark blue luminal A, light blue luminal B)

References

    1. Parkin DM, Pisani P, Ferlay J. Estimates of the worldwide incidence of 25 major cancers in 1990. Int J Cancer. 1999;80(6):827–841. doi: 10.1002/(SICI)1097-0215(19990315)80:6<827::AID-IJC6>3.0.CO;2-P. - DOI - PubMed
    1. Maki DD, Grossman RI. Patterns of disease spread in metastatic breast carcinoma: influence of estrogen and progesterone status. Am J Neuroradiol. 2000;21:1064–1066. - PMC - PubMed
    1. Smid M, Wang Y, Zhang Y, et al. Subtypes of breast cancer show preferential site of relapse. Cancer Res. 2008;68(9):3108–3114. doi: 10.1158/0008-5472.CAN-07-5644. - DOI - PubMed
    1. Kennecke H, Yerushalmi R, Woods R, et al. Metastatic behavior of breast cancer subtypes. J Clin Oncol. 2010;28(20):3271–3277. doi: 10.1200/JCO.2009.25.9820. - DOI - PubMed
    1. Herschkowitz JI, Simin K, Weigman VJ, et al. Identification of conserved gene expression features between murine mammary carcinoma models and human breast tumors. Genome Biol. 2007;8(5):R76. doi: 10.1186/gb-2007-8-5-r76. - DOI - PMC - PubMed

Publication types

MeSH terms