. 2011 Oct;107(1):90-100.
doi: 10.1016/j.pbiomolbio.2011.05.002. Epub 2011 Jun 13.

Rabbit-specific ventricular model of cardiac electrophysiological function including specialized conduction system

Affiliations

Rabbit-specific ventricular model of cardiac electrophysiological function including specialized conduction system

R Bordas et al. Prog Biophys Mol Biol. 2011 Oct.

Abstract

The function of the ventricular specialized conduction system in the heart is to ensure the coordinated electrical activation of the ventricles. It is therefore critical to the overall function of the heart, and has also been implicated as an important player in various diseases, including lethal ventricular arrhythmias such as ventricular fibrillation and drug-induced torsades de pointes. However, current ventricular models of electrophysiology usually ignore, or include highly simplified representations of the specialized conduction system. Here, we describe the development of an image-based, species-consistent, anatomically-detailed model of rabbit ventricular electrophysiology that incorporates a detailed description of the free-running part of the specialized conduction system. Techniques used for the construction of the geometrical model of the specialized conduction system from a magnetic resonance dataset and integration of the system model into a ventricular anatomical model, developed from the same dataset, are described. Computer simulations of rabbit ventricular electrophysiology are conducted using the novel anatomical model and rabbit-specific membrane kinetics to investigate the importance of the components and properties of the conduction system in determining ventricular function under physiological conditions. Simulation results are compared to panoramic optical mapping experiments for model validation and results interpretation. Full access is provided to the anatomical models developed in this study.


Figures

Figure 1
Figure 1
1a shows a transerve slice through the high resolution rabbit MRI dataset, the left ventricle (LV) and right ventricle (RV) are labelled. Arrows highlight example free running Purkinje fibres (labelled PF). 1b and 1c show segmentations of the free running Purkinje-system (FRPS), overlaid on slices through the MR dataset, in the left and right ventricles, respectively.
Figure 2
Figure 2
Three phases of specialized conduction system (SCS) model construction overlaid on the endocardial surfaces. Purkinje-Ventricular (PV) junction points are shown as green spheres. The LV is on the right hand side in each case. 2a shows the skeletonized cable model of the FRPS developed based on segmentation of the MR dataset. 2b shows the bundle of His and bundle branches developed based on descriptions in the literature and the intersection of the FRPS with the septal wall. 2c shows the distal endocardial bound Purkinje system generated using the L-system based algorithm (Ijiri et al., 2008).
Figure 3
Figure 3
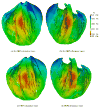
Time of first activation of the epicardium after stimulation of the bundle of His. 3a and 3b show the epicardial activation patterns on the left and right ventricle, respectively, for the simplified model without the free-running Purkinje system (FRPS). 3c and 3d show epicardial activation for the full model incorporating FRPS. Activation times are given relative to the time of first epicardial breakthrough, which occurred 16 ms after stimulation of the bundle of His in both models. First breakthrough also occurred at the same location in each model: towards the posterior of the right ventricle free wall.
Figure 4
Figure 4
Epicardial activation of normal sinus rhythm in rabbit heart from the panoramic optical mapping of Langendorff-perfused rabbit heart. Activation maps of the right ventricle (RV, top) and the left ventricle (LV, bottom) epicardium are shown. Each color in the activation map spans an interval of 1ms. The corresponding views of the rabbit heart are shown on the left. Electrocardiogram (ECG) and action potentials (AP) at three different locations marked by numbers in the activation maps are shown on the right. Note that the upstroke of AP3 appears later compared with the upstroke of AP1. It can be seen that the first activation on the epicardium starts in the RV, which is qualitatively similar to what is shown in our simulation (Figure 3).
Figure 5
Figure 5
Time of first activation in the endocardium after stimulation of the bundle of His. 5a and 5b show activation when the FRPS is removed from the SCS model. 5c and 5d show activation with the FRPS integrated into the SCS model. The FPRS results in faster and more uniform activation of the endocardial surface. Activation of the LV papillary muscles, the lower septum and both free walls occurs noticeably earlier when the FRPS is integrated.
Figure 6
Figure 6
6a and 6b show distribution of first activation times in the ventricular model, with the simplified and full SCS model, respectively. The integration of FRPS results in faster and more uniform activation throughout the myocardium.

References

    1. Ansari A, Ho S, Anderson RH. Distribution of the Purkinje fibres in the sheep heart. The Anatomical Record. 1999;254:92–97. - PubMed
    1. Azzouzi A, Coudiere Y, Turpault R. A mathematical model of the ventricular conduction system. ICNAAM 2010 AIP Conf Proc. 2010;1281:403–406.
    1. Berenfeld O, Abboud S. Simulation of cardiac activity and the ecg using a heart model with a reaction-diffusion action potential. Med Eng Phys. 1996;18:615–625. - PubMed
    1. Berenfeld O, Jalife J. Purkinje-muscle reentry as a mechanism of polymorphic ventricular arrhythmias in a 3-dimensional model of the ventricles. Circ Res. 1998;82:1063–1077. - PubMed
    1. Bishop M, Rodriguez B, Eason J, Whiteley JP, Trayanova NA, Gavaghan D. Synthesis of voltage-sensitive optical signals: Application to panoramic optical mapping. Biophys J. 2006;90:2938–2945. - PMC - PubMed

Publication types

LinkOut - more resources