. 2011 Aug 1;17(15):5016-25.
doi: 10.1158/1078-0432.CCR-11-0050. Epub 2011 Jun 14.

Fibroblast growth factor receptors are components of autocrine signaling networks in head and neck squamous cell carcinoma cells

Affiliations

Fibroblast growth factor receptors are components of autocrine signaling networks in head and neck squamous cell carcinoma cells

Marianne E Marshall et al. Clin Cancer Res. .

Abstract

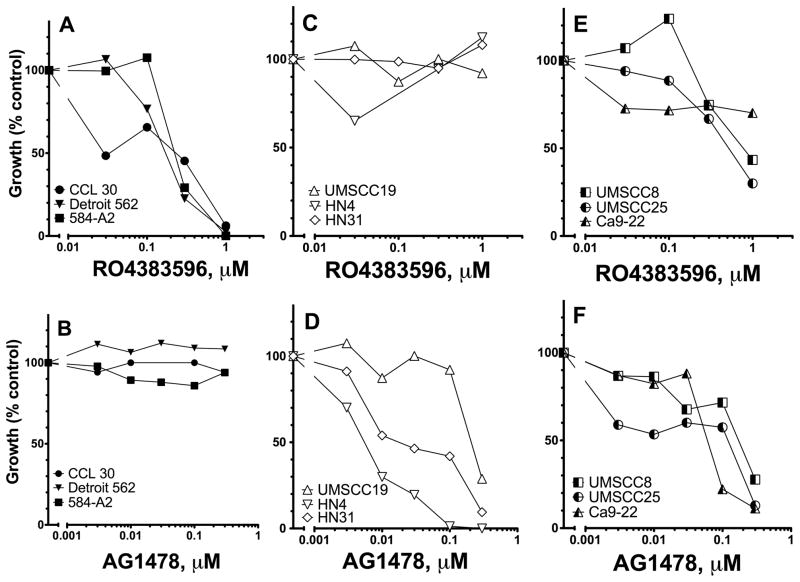
Purpose: We previously reported that a fibroblast growth factor (FGF) receptor (FGFR) signaling pathway drives growth of lung cancer cell lines of squamous and large cell histologies. Herein, we explored FGFR dependency in cell lines derived from the tobacco-related malignancy, head and neck squamous cell carcinoma (HNSCC).

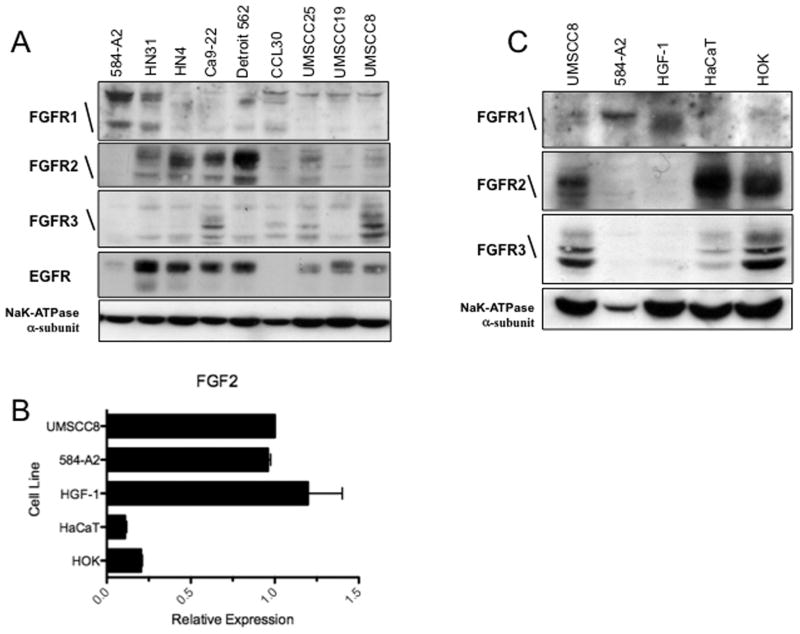
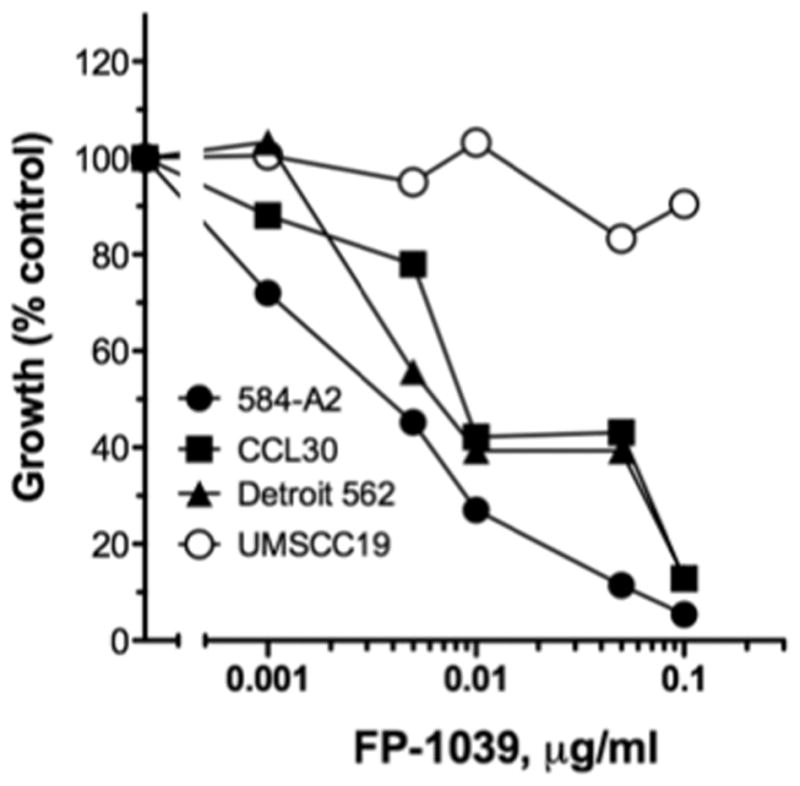
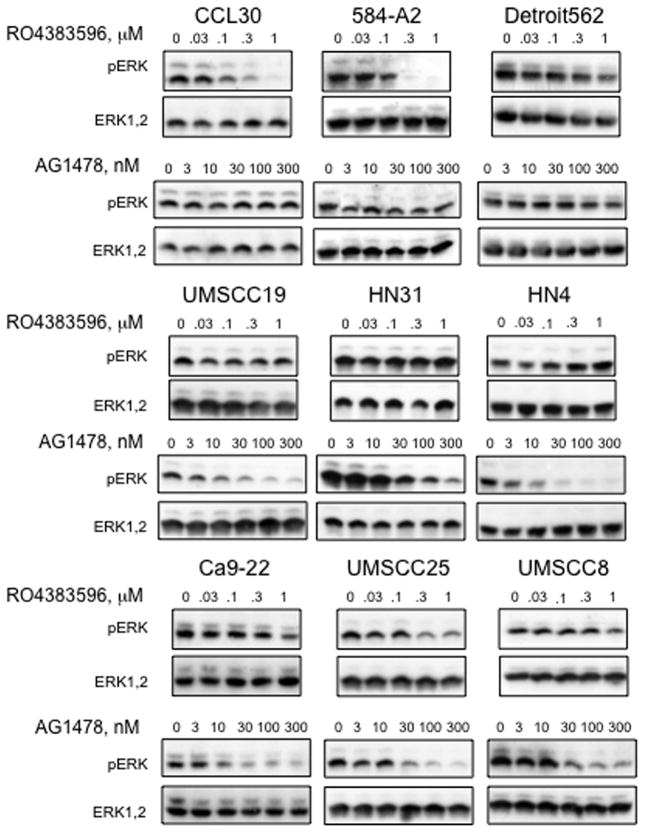
Experimental design: FGF and FGFR mRNA and protein expression was assessed in nine HNSCC cell lines. Dependence on secreted FGF2 for cell growth was tested with FP-1039, an FGFR1-Fc fusion protein. FGFR and epidermal growth factor receptor (EGFR) dependence was defined by sensitivity to multiple inhibitors selective for FGFRs or EGFR.

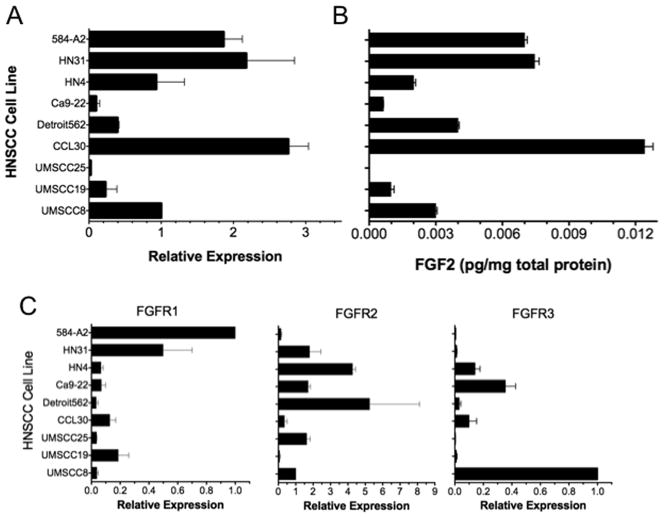
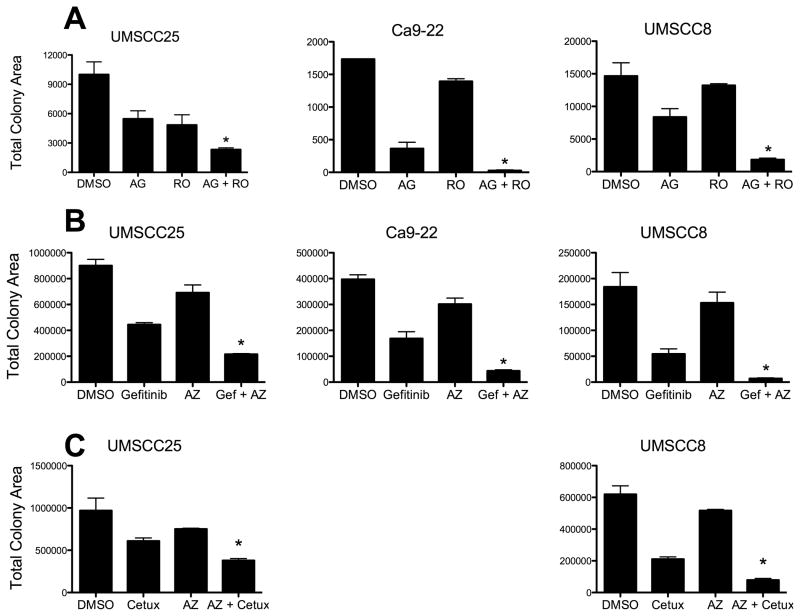
Results: FGF2 was expressed in eight of the nine HNSCC cell lines examined. Also, FGFR2 and FGFR3 were frequently expressed, whereas only two lines expressed FGFR1. FP-1039 inhibited growth of HNSCC cell lines expressing FGF2, identifying FGF2 as an autocrine growth factor. FGFR inhibitors selectively reduced in vitro growth and extracellular signal-regulated kinase signaling in three HNSCC cell lines, whereas three distinct lines exhibited responsiveness to both EGFR and FGFR inhibitors. Combinations of these drugs yielded additive growth inhibition. Finally, three cell lines were highly sensitive to EGFR tyrosine kinase inhibitors (TKI) with no contribution from FGFR pathways.

Conclusions: FGFR signaling was dominant or codominant with EGFR in six HNSCC lines, whereas three lines exhibited little or no role for FGFRs and were highly EGFR dependent. Thus, the HNSCC cell lines can be divided into subsets defined by sensitivity to EGFR and FGFR-specific TKIs. FGFR inhibitors may represent novel therapeutics to deploy alone or in combination with EGFR inhibitors in HNSCC.


Figures

Figure 1
Figure 1. Expression of FGF2 and FGFRs in HNSCC cell lines
A, Total RNA prepared from a panel of nine HNSCC cell lines was reverse transcribed and submitted to quantitative real-time PCR for FGF2 mRNA. The values are normalized to GAPDH mRNA measured in replicate samples and presented as relative expression. B, Cellular FGF2 protein was measured in the nine HNSCC cell lines by ELISA (R&D Systems). The data are the means and SEM of 3 independent experiments. C, Quantitative RT-PCR assays for FGFR1, FGFR2 and FGFR3 mRNAs were performed on the nine HNSCC cell lines and normalized for GAPDH mRNA levels. The data are the means and SEM of 3 or more replicate experiments.
Figure 2
Figure 2. Expression of FGFRs in HNSCC cell lines and normal cellular constituents of oral tissue
A, Cell lysates from the indicated HNSCC cell lines were immunoblotted for FGFR1, FGFR2, FGFR3, EGFR and the NaK-ATPase α-subunit as a loading control. B, Total RNA prepared from HNSCC cell lines (UMSCC8 and 584-A2), primary human oral keratinocytes (HOK), immortalized human keratinocytes (HaCaT cells) and human gingival fibroblasts (HGF-1) was reversed transcribed and submitted to RT-PCR for FGF2 mRNA. The values are normalized to GAPDH mRNA as described in Figure 1A. C, Cell lysates from the indicated cell lines were immunoblotted for FGFR1, FGFR2, FGFR3 and the NaK-ATPase α-subunit as a loading control.
Figure 3
Figure 3. Effect of the FGF ligand trap, FP-1039, on growth of HNSCC cells
The indicated HNSCC cell lines were submitted to anchorage-independent growth assays in the presence of the indicated concentrations of FP-1039 as described in the Materials and Methods. As shown in Figure 1, 584-A2, CCL30 and Detroit562, but not UMSCC19, express FGF2 mRNA and protein.
Figure 4
Figure 4. Inhibition of basal ERK phosphorylation by EGFR and FGFR-specific TKIs in HNSCC cell lines
HNSCC cell lines were incubated in serum-free HITES media for 2 hours and then treated with DMSO (control), the FGFR inhibitor, RO4383596, or the EGFR inhibitor, AG1478, at the indicated concentrations for 2 hours. Cell-free extracts were prepared as described in the Materials and Methods and immunoblotted for phospho-ERK. The filters were subsequently stripped and re-probed for total ERK1 and ERK2 to verify equal loading. The data are representative of at least two independent experiments for each cell line.
Figure 5
Figure 5. Effect of EGFR and FGFR TKIs on growth of HNSCC cell lines
HNSCC cell lines were submitted to clonogenic assays (UMSCC8, UMSCC25, Ca9-22, HN31) or anchorage-independent growth assays (UMSCC19, CCL30, Detroit562, HN4, 584-A2) in the absence (DMSO, control) or presence of indicated concentrations of RO4383596 or the EGFR-specific TKI, AG1478, as described in the Materials and Methods. Cell lines exhibiting sensitivity to RO4383596, but not AG1478 (A and B) sensitivity to AG1478, but not RO4383596 (C and D), or sensitivity to both RO4383596 and AG1478 (E and F) are grouped accordingly.
Figure 6
Figure 6. Inhibition of HNSCC growth by combinations of FGFR and EGFR-specific inhibitors
A, The indicated HNSCC cell lines shown to be responsive to both EGFR and FGFR-specific TKIs (Fig. 5E and F) were submitted to a clonogenic growth assay in the absence (DMSO, control) or presence of the FGFR TKI, RO4383596 (300 nM), the EGFR-specific TKI, AG1478 (100 nM) or both drugs (AG + RO) at the same concentrations. Clonogenic growth assays were performed with B, EGFR-specific TKI, gefitinib (100 nM), and/or the FGFR- specific TKI, AZ12908010 (300 nM) or C, cetuximab (1 μg/ml) in the presence or absence of AZ12908010 (300 nM). After 2 weeks, colonies were stained and quantified as described in the Materials and Methods. The data are the means and SEM where * indicates p value < 0.05 by unpaired student t test relative to EGFR inhibitor treatment alone.

References

    1. Bozec A, Peyrade F, Fischel JL, Milano G. Emerging molecular targeted therapies in the treatment of head and neck cancer. Expert Opin Emerg Drugs. 2009;14:299–310. - PubMed
    1. Egloff AM, Grandis JR. Improving Response Rates to EGFR-Targeted Therapies for Head and Neck Squamous Cell Carcinoma: Candidate Predictive Biomarkers and Combination Treatment with Src Inhibitors. J Oncol. 2009;2009:896407. - PMC - PubMed
    1. Haddad RI, Shin DM. Recent advances in head and neck cancer. N Engl J Med. 2008;359:1143–54. - PubMed
    1. Murdoch D. Standard, and novel cytotoxic and molecular-targeted, therapies for HNSCC: an evidence-based review. Curr Opin Oncol. 2007;19:216–21. - PubMed
    1. Kalyankrishna S, Grandis JR. Epidermal growth factor receptor biology in head and neck cancer. J Clin Oncol. 2006;24:2666–72. - PubMed

Publication types

MeSH terms

Substances