. 2011 Nov;28(11):3195-211.
doi: 10.1093/molbev/msr155. Epub 2011 Jun 14.

A pilot study of bacterial genes with disrupted ORFs reveals a surprising profusion of protein sequence recoding mediated by ribosomal frameshifting and transcriptional realignment

Affiliations

A pilot study of bacterial genes with disrupted ORFs reveals a surprising profusion of protein sequence recoding mediated by ribosomal frameshifting and transcriptional realignment

Virag Sharma et al. Mol Biol Evol. 2011 Nov.

Abstract

Bacterial genome annotations contain a number of coding sequences (CDSs) that, in spite of reading frame disruptions, encode a single continuous polypeptide. Such disruptions have different origins: sequencing errors, frameshift, or stop codon mutations, as well as instances of utilization of nontriplet decoding. We have extracted over 1,000 CDSs with annotated disruptions and found that about 75% of them can be clustered into 64 groups based on sequence similarity. Analysis of the clusters revealed deep phylogenetic conservation of open reading frame organization as well as the presence of conserved sequence patterns that indicate likely utilization of the nonstandard decoding mechanisms: programmed ribosomal frameshifting (PRF) and programmed transcriptional realignment (PTR). Further enrichment of these clusters with additional homologous nucleotide sequences revealed over 6,000 candidate genes utilizing PRF or PTR. Analysis of the patterns of conservation apparently associated with nontriplet decoding revealed the presence of both previously characterized frameshift-prone sequences and a few novel ones. Since the starting point of our analysis was a set of genes with already annotated disruptions, it is highly plausible that in this study, we have identified only a fraction of all bacterial genes that utilize PRF or PTR. In addition to the identification of a large number of recoded genes, a surprising observation is that nearly half of them are expressed via PTR-a mechanism that, in contrast to PRF, has not yet received substantial attention.


Figures

F<sc>IG</sc>. 1.
FIG. 1.
An example of a gene with a CDS containing a disrupted ORF (smpB from Buchnera aphidicola). (A) ORF organization. Three translational phases are represented as three boxes. Stop and start codons are shown, respectively, as major and minor vertical dashes within each box. The location of the disruption is shown as a dotted line throughout all three boxes. Regions corresponding to the annotated CDS are highlighted in gray. Three major possible causes of disruptions and their distinct characteristics are summarized in the table below. (B) A fragment of the B. aphidicola completed genome (NC_008513) annotation, corresponding to the smpB gene, in GenBank format.
F<sc>IG</sc>. 2.
FIG. 2.
Distribution of differences between the lengths of CDSs and the lengths of the corresponding genomic sequences for genes with disrupted ORFs. The threshold of 12 nt that was used to select genes for further analysis is indicated.
F<sc>IG</sc>. 3.
FIG. 3.
Schemes for the analysis of genes with disrupted ORFs: (A) A pipeline for filtering genes with annotated disruptions prior to the initial clustering based on sequence similarity. (B) Scheme for the analysis of the detected clusters.
F<sc>IG</sc>. 4.
FIG. 4.
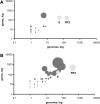
Representation of genes and genomes in the clusters: axis y indicates the number of genes in each cluster; axis x shows the number of genomes represented in each cluster. The areas of disks are proportional to the number of genes in the clusters. The white disk with vertical gray stripes (also indicated as S) represents singletons–genes that did not cluster. The white disk with horizontal gray stripes (also indicated as RF2) represents cluster 2 (RF2 genes). Clusters containing mobile genetic elements (transposons and IS elements) are shown as gray disks. Clusters of genes with other functions are shown as black disks. (A) Clusters containing genes with annotated disruptions (prior to the enrichment). (B) Clusters after the enrichment (annotated genes and their homologs identified using TBLASTN).
F<sc>IG</sc>. 5.
FIG. 5.
Alignment statistics for cluster 4: (Panels 1–3) The positions of stop codons in each of the three forward reading frames are shown as blue triangles. ORF1 and ORF2 have been fused in-frame by artificially inserting an “N” in each sequence just 5′ of the first ORF1-frame stop codon. Thus, the region of ORF2 that overlaps ORF1 appears as a short ORF which, in this case, is in the +2 reading frame, while the fusion of ORF1 with the remainder of ORF2 appears as a single long ORF in the +0 frame. (Panel 4) The gray area comprises 106 horizontal bars indicating the region of overlap between ORF1 and ORF2 in each of the 106 distinct sequences in the alignment (the bars are ordered by the location of their 5′ ends). Statistics for the start and end of the overlap region are summarized in the blue and pink boxplots, respectively. (Panels 5–6) Conservation at synonymous sites with respect to the +0 reading frame, for details, see Firth and Atkins (2009). (5) depicts the probability that the degree of conservation within a given window could be obtained under a null model of neutral evolution at synonymous sites, while (6) depicts the absolute amount of conservation as represented by the ratio of the observed number of substitutions within a given window to the number expected under the null model. There is a striking peak in synonymous site conservation coinciding with the region of frame transition. (Panel 7) Phylogenetically summed sequence divergence for the sequences that contribute to the conservation statistics at each position in the alignment. (In any particular alignment column, some sequences may be omitted from the statistical calculations due to alignment gaps, leading to a reduced statistical signal.) Although we failed to identify the sequence pattern responsible for nonstandard decoding in cluster 4, the plots clearly point to its presence.
F<sc>IG</sc>. 6.
FIG. 6.
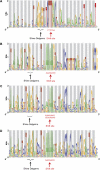
Sequence logos representing 70 nucleotides (PRF patterns in the center) of sequence alignments from corresponding clusters. Shading is used for the first and the second positions of codons corresponding to the translational phase of ORF1. Frameshift-prone patterns (with codons in the initial frame separated by vertical dashes) and potential frameshift-facilitating Shine–Dalgarno sequences are indicated below each sequence logo. (A) Cluster 2 (+1 PRF). (B) Cluster 11 (−1 PRF). (C) Cluster 18 (−1 PRF). (D) Cluster 42 (−1 PRF).
F<sc>IG</sc>. 7.
FIG. 7.
Sequence logos representing PTR examples. Logos are organized as in figure 6. Sequences of actual PTR patterns occurring in the alignments used for the generation of sequence logos are shown below each logo; only those patterns that have been found in at least five sequences within the alignment are shown. (A) Cluster 6. (B) Cluster 7. (C) Cluster 46. (D) Cluster 60.
F<sc>IG</sc>. 8.
FIG. 8.
Frequency distribution of events resulting in disruptions of CDSs. (A and B) Distribution of event frequencies across 64 clusters. (C and D) Distribution of event frequencies among genes with annotated disruptions in the 64 clusters prior to enrichment. (E and F) Distribution of frequencies of nonstandard decoding mechanisms in the gene clusters after enrichment with nonannotated homologs. (A, C, and E) Functional classification of genes in the clusters. The white area represents genes that are expressed via nontriplet decoding for which we found strong evidence of functionality. The gray area (No Evidence of Purifying Selection—NEPS) represents genes for which we have no evidence of purifying selection acting on them. Some of these genes may be pseudogenes. The black area (Dump) contains all genes or pseudogenes that were not considered to be expressed as a result of PRF or PTR, for example, sequencing errors, misannotations, recent mutations, and phase variation. (B, D, and F) Distribution of frequencies of nontriplet decoding mechanisms among the presumably functional disrupted ORFs: The inner disk is divided into four categories. The gray area corresponds to genes in which we were unable to identify the mechanism. The blue area corresponds to PRF. The red area corresponds to PTR. The pink area corresponds to genes where both mechanisms seem to be plausible, that is, both PRF and PTR patterns are present. The areas corresponding to PRF and PRF/PTR are further differentiated on −1 and +1 frameshifting mechanisms within the outer disk.

References

    1. Adamski FM, Donly BC, Tate WP. Competition between frameshifting, termination and suppression at the frameshift site in the Escherichia coli release factor-2 mRNA. Nucleic Acids Res. 1993;21:5074–5078. - PMC - PubMed
    1. Antonov I, Borodovsky M. Genetack: frameshift identification in protein-coding sequences by the Viterbi algorithm. J Bioinform Comput Biol. 2010;8:535–551. - PubMed
    1. Atkins JF, Baranov PV. The distinction between recoding and codon reassignment. Genetics. 2010;185:1535–1536. - PMC - PubMed
    1. Atkins JF, Baranov PV, Fayet O, et al. (13 co-authors) Overriding standard decoding: implications of recoding for ribosome function and enrichment of gene expression. Cold Spring Harb Symp Quant Biol. 2001;66:217–232. - PubMed
    1. Atkins JF, Gesteland RF, editors. Recoding: expansion of decoding rules enriches gene expression. New York: Springer; 2010.

Publication types