. 2011 Jun 14:2:353.
doi: 10.1038/ncomms1354.

Revealing the high-energy electronic excitations underlying the onset of high-temperature superconductivity in cuprates

Affiliations

Revealing the high-energy electronic excitations underlying the onset of high-temperature superconductivity in cuprates

Claudio Giannetti et al. Nat Commun. .

Abstract

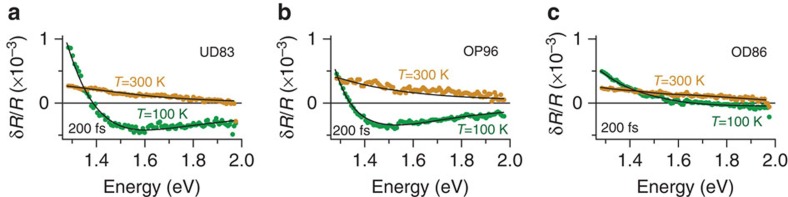
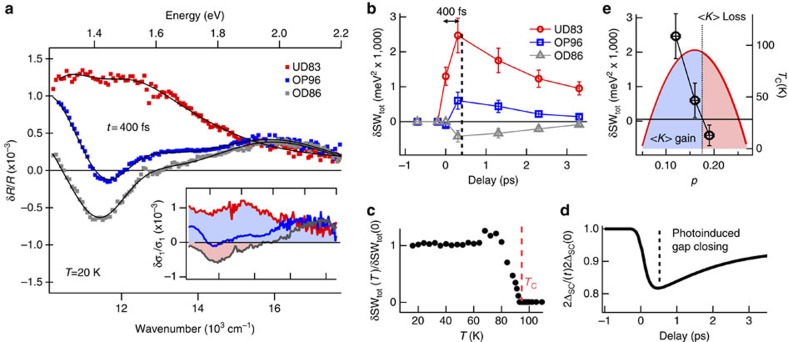
In strongly correlated systems the electronic properties at the Fermi energy (E(F)) are intertwined with those at high-energy scales. One of the pivotal challenges in the field of high-temperature superconductivity (HTSC) is to understand whether and how the high-energy scale physics associated with Mott-like excitations (|E-E(F)|>1 eV) is involved in the condensate formation. Here, we report the interplay between the many-body high-energy CuO(2) excitations at 1.5 and 2 eV, and the onset of HTSC. This is revealed by a novel optical pump-supercontinuum-probe technique that provides access to the dynamics of the dielectric function in Bi(2)Sr(2)Ca(0.92)Y(0.08)Cu(2)O(8+δ) over an extended energy range, after the photoinduced suppression of the superconducting pairing. These results unveil an unconventional mechanism at the base of HTSC both below and above the optimal hole concentration required to attain the maximum critical temperature (T(c)).


Figures

Figure 1
Figure 1. Dielectric function of optimally doped Bi2Sr2Ca0.92Y0.08Cu2O8+δ.
(a) The high-energy region of the imaginary part of the ab-plane dielectric function, measured at T=20 K for the optimally doped sample (estimated hole concentration p=0.16, ref. 46), is shown. The thin black line is the fit to the data described in the text. The values of the parameters resulting from the fit are reported in the Supplementary Table S1. The contributions of the individual interband oscillators at ω0i∼1.46, 2, 2.72 and 3.85 eV are indicated as colour-patterned areas. The real part of the dielectric function, with the respective fit, is shown in the inset. Supplementary Figure S1 shows the fits to the reflectivity for T=300 and 100 K and the extracted I2χ(Ω). (b) Schematics of the ZRS and of the in-plane CT process between Cu and O atoms. (c) The atomic orbitals involved in the charge transfer and Zhang-Rice singlet (ZRS) are schematically indicated. (d) Cartoon of the electron density of states (DOES) (ref. 27). The red and blue arrows represent transitions between mixed Cu–O states and involving a 3d10 configuration in the final state, respectively.
Figure 2
Figure 2. Energy- and time-resolved reflectivity on Bi2Sr2Ca0.92Y0.08Cu2O8+δ.
The dynamics of the reflectivity is measured over a broad spectral range. The two-dimensional scans of δR/R(ω,t) are reported for three different doping regimes (first column: underdoped (UD), Tc=83 K; second column: optimally doped (OP), Tc=96 K; third column: overdoped (OD), Tc=86 K), in the normal (first row), pseudogap (second row) and superconducting phases (third row). See Methods for estimation of hole content p. The insets display schematically the position of each scan in the T-p phase diagram of Bi2Sr2Ca0.92Y0.08Cu2O8+δ. The white lines (right axes) are the time traces at 1.5 eV photon energy.
Figure 3
Figure 3. Energy-resolved spectra and differential fit in the normal and pseudogap phases.
(ac) The maximum δR/R(ω,t)=Rneq(ω,t)/Req(ω,t)−1 (Rneq(ω,t) and Req(ω,t) being the non-equilibrium (pumped) and equilibrium (unpumped) reflectivities), measured in the normal (T=300 K, yellow dots) and pseudogap (T=100 K, green dots) phases, is reported for different doping regimes (underdoped (UD83), Tc=83 K; optimally doped (OP96), Tc=96 K; overdoped (OD86), Tc=86 K). The solid lines are the differential fit to the data. The δR/R(ω,t) related to the effective temperature increase is shown in the Supplementary Figure S2. In both the normal and the pseudogap phases, the maximum of the fast reflectivity variation is measured at t=200 fs, that is, directly after all the energy of the 140 fs pump pulses has been delivered to the system.
Figure 4
Figure 4. Energy-resolved spectra and differential fit in the superconducting phase.
(a) The δR/R(ω,t) at t=400 fs, that is, the delay at which the maximum signal is measured, is shown for three different dopings in the superconducting phase (T=20 K). The black solid lines are differential fits to the data obtained assuming a modification of the 1.5 and 2 eV interband transitions. The values of the fitting parameters for the optimally doped sample (OP96) are reported in the Supplementary Table S2. The inset displays the relative variation of the optical conductivity for the three dopings, obtained from the data. The scale of the horizontal axis is the same as in the main panel. (b) The spectral weight variation, δSWtot=δSW1.5 eV+δSW2 eVω2p(1.5)/8+δω2p(2)/8 (ωp(1.5) and ωp(2) being the plasma frequencies of the interband Lorentz oscillators at 1.5 and 2 eV), is reported at different delays for the three dopings. The maximum value of δSWtot corresponds to the minimum ΔSC value at ∼400 fs, that is, after a partial electron-boson thermalization. The error bars represent the standard deviation obtained from the fit. (c) The δSWtot value, relative to the extrapolated zero-temperature value, is estimated from single-colour measurements and reported as a function of the temperature for OP96. Similar results are obtained for UD83 and OD86. (d) The dynamics of the superconducting gap, assuming the proportionality between δR/R(ω,t) and the photoexcited quasiparticle density, is reported (Supplementary Note 4). At a pump fluence of 10 μJ cm−2, the maximum gap decrease is ∼20% at 400 fs delay time. (e), The black circles represent the maximum δSWtot=δSW1.5 eV+δSW2 eV, observed at 400 fs, as a function of the doping level. The error bars take into account the stability of the differential fit on the equilibrium dielectric function (Supplementary Notes 1,2). The left axis has the same units as panel b. The Tc–p phase diagram is reported on the right-top axes.

References

    1. Meinders M. B. J., Eskes H. & Sawatzky G. A. Spectral-weight transfer: breakdown of low-energy-scale sum rules in correlated systems. Phys. Rev. B 48, 3916–3926 (1993). - PubMed
    1. Zhang F. C. & Rice T. M. Effective Hamiltonian for the superconducting Cu oxides. Phys. Rev. B 37, 3759–3761 (1988). - PubMed
    1. Zaanen J., Sawatzky G. A. & Allen J. W. Band gaps and electronic structure of transition-metal compounds. Phys. Rev. Lett. 55, 418–421 (1985). - PubMed
    1. Tinkham M. Introduction to Superconductivity, McGraw-Hill, (1996).
    1. Basov D. N. & Timusk T. Electrodynamics of high-Tc superconductors. Rev. Mod. Phys. 77, 721–779 (2005).

Publication types