. 2011;6(5):e20183.
doi: 10.1371/journal.pone.0020183. Epub 2011 May 27.

Evolution and taxonomic classification of human papillomavirus 16 (HPV16)-related variant genomes: HPV31, HPV33, HPV35, HPV52, HPV58 and HPV67

Affiliations

Evolution and taxonomic classification of human papillomavirus 16 (HPV16)-related variant genomes: HPV31, HPV33, HPV35, HPV52, HPV58 and HPV67

Zigui Chen et al. PLoS One. 2011.

Abstract

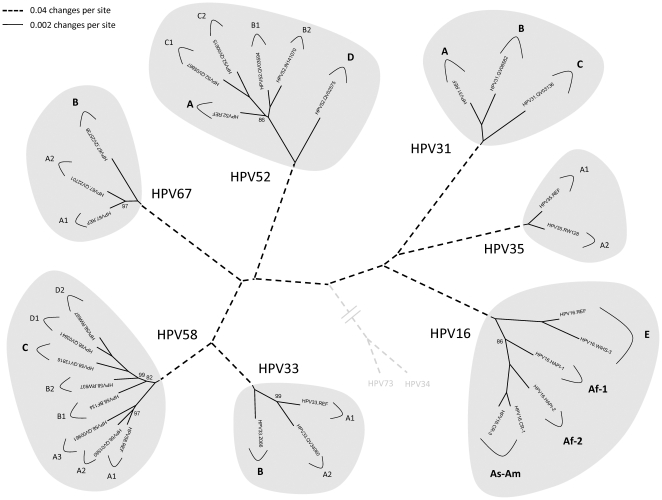
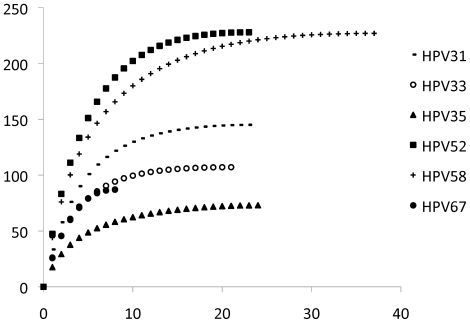
Background: Human papillomavirus 16 (HPV16) species group (alpha-9) of the Alphapapillomavirus genus contains HPV16, HPV31, HPV33, HPV35, HPV52, HPV58 and HPV67. These HPVs account for 75% of invasive cervical cancers worldwide. Viral variants of these HPVs differ in evolutionary history and pathogenicity. Moreover, a comprehensive nomenclature system for HPV variants is lacking, limiting comparisons between studies.

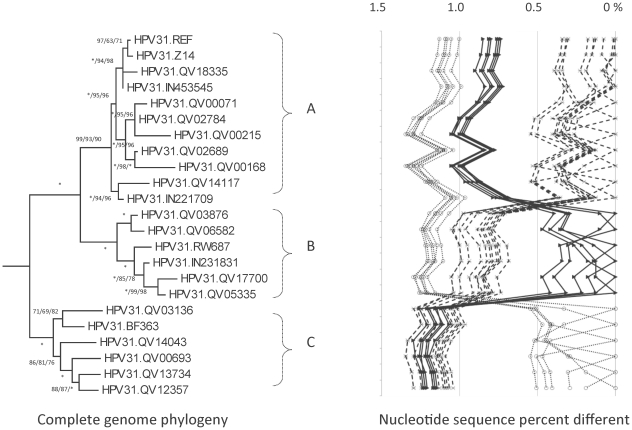
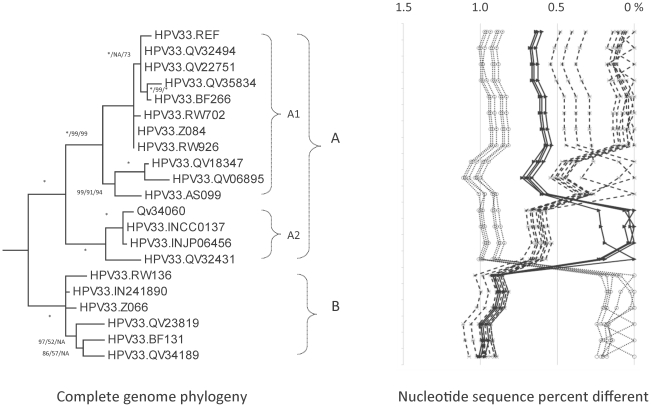
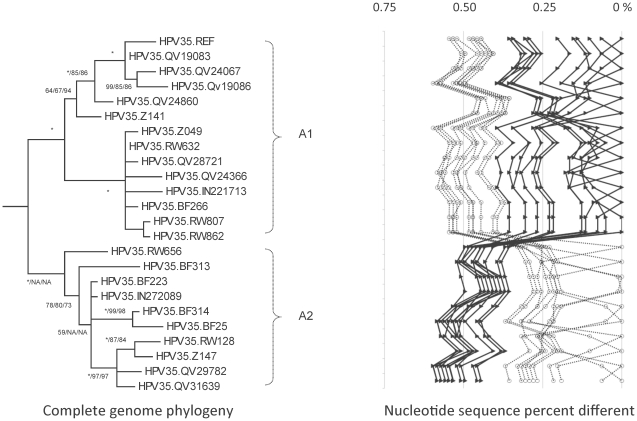
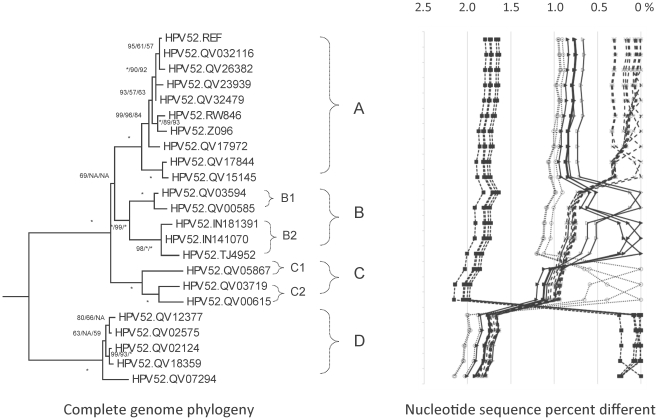
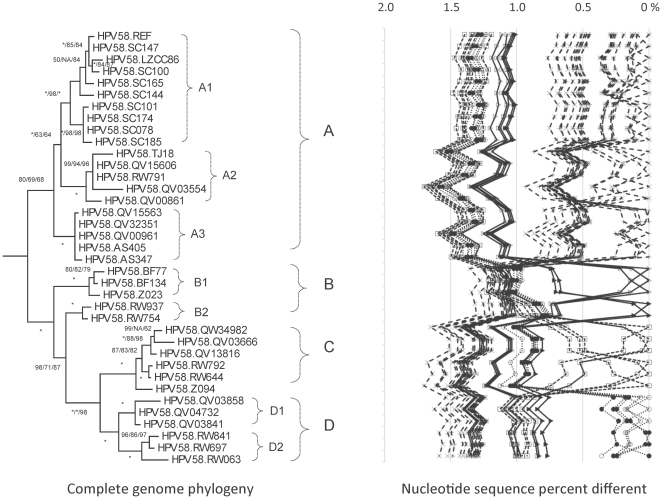
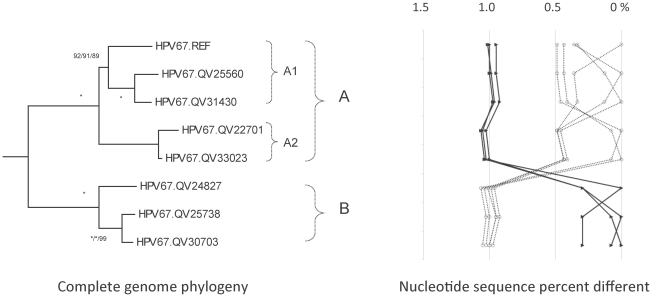
Methods: DNA from cervical samples previously characterized for HPV type were obtained from multiple geographic regions to screen for novel variants. The complete 8 kb genomes of 120 variants representing the major and minor lineages of the HPV16-related alpha-9 HPV types were sequenced to capture maximum viral heterogeneity. Viral evolution was characterized by constructing phylogenic trees based on complete genomes using multiple algorithms. Maximal and viral region specific divergence was calculated by global and pairwise alignments. Variant lineages were classified and named using an alphanumeric system; the prototype genome was assigned to the A lineage for all types.

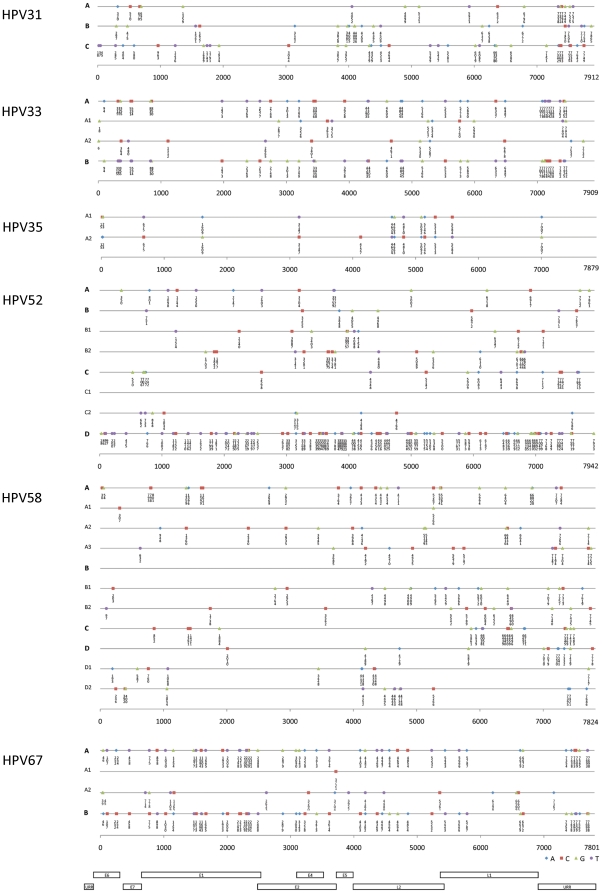
Results: The range of genome-genome sequence heterogeneity varied from 0.6% for HPV35 to 2.2% for HPV52 and included 1.4% for HPV31, 1.1% for HPV33, 1.7% for HPV58 and 1.1% for HPV67. Nucleotide differences of approximately 1.0% - 10.0% and 0.5%-1.0% of the complete genomes were used to define variant lineages and sublineages, respectively. Each gene/region differs in sequence diversity, from most variable to least variable: noncoding region 1 (NCR1) /noncoding region 2 (NCR2) >upstream regulatory region (URR)> E6/E7 > E2/L2 > E1/L1.

Conclusions: These data define maximum viral genomic heterogeneity of HPV16-related alpha-9 HPV variants. The proposed nomenclature system facilitates the comparison of variants across epidemiological studies. Sequence diversity and phylogenies of this clinically important group of HPVs provides the basis for further studies of discrete viral evolution, epidemiology, pathogenesis and preventative/therapeutic interventions.


Conflict of interest statement

Competing Interests: The authors have declared that no competing interests exist.

Figures

Figure 1
Figure 1. Alpha-9 phylogenetic tree showing representative types and variant lineages.
A phylogenetic tree was constructed using the MrBayes (v3.1.2) program inferred from the global alignment of complete circular genome nucleotide sequences linearized at the first ATG of the E1 ORF. To root the tree, HPV34 and HPV73 prototype sequences (NCBI accession numbers NC_001587 and NC_006165, respectively) were set as the outgroup and are represented by grey broken lines. The Bayesian credibility values less than 100 were indicated on or near the branch nodes. The shaded areas represent groupings of lineages and sublineages of HPV16, HPV31, HPV33, HPV35, HPV52, HPV58 and HPV67. The length of broken and solid lines represent distance between clades, although the number of changes is different for these two lines, the scale is indicated in the upper left corner of the figure.
Figure 2
Figure 2. HPV31variant tree topologies andpairwise comparisons of individual complete genomes.
Bayesian trees were inferred from global alignment of complete genome nucleotide sequences (the other HPV16-related HPV reference prototypes were set as the outgroup). Numbers on or near branches indicate support indices in the following order: Bayesian credibility value using MrBayes v3.1.2 , maximum parsimony (MP) bootstrap percentage and neighbor joining (NJ) bootstrap percentage using PAUP* v4.0b10 . An asterisk (*) indicates 100% agreement between methods. “NA” reflects disagreement between a method and the reference Bayesian tree at a given node. Thus, one tree is shown, but three different methods of tree construction were used to estimate the support of the provided tree, as explained above. Distinct variant lineages (i.e., termed A, B, and C) are classified according to the topology and nucleotide sequence differences from >1% to <10%. The percent nucleotide sequence differences were calculated for each isolate compared to all other isolates of the same type based on the complete genome nucleotide sequences and are shown in the panel to the right of each phylogeny. Values for each comparison of a given isolate are connected by lines and the comparison to self is indicated by the 0% difference point. Symbols and lines used are different for each distinct variant lineage to facilitate visual comparisons. For example, percentage differences of variant lineage A are indicated by X's and connected by broken lines; values for isolates of variant lineage B are indicated by closed triangles and connected by solid lines; and, difference values of lineage C isolates are indicated by open circles and connected by a dotted line.
Figure 3
Figure 3. HPV33 variant tree topologies and pairwise comparisons of individual complete genomes.
The phylogenetic tree was constructed as described in Figure 2. Distinct variant lineages (i.e., termed A and B) are classified according to the topology and nucleotide sequence differences from >1% to <10%. Distinct sublineages (i.e., termed A1 and A2) were also inferred from the tree topology and nucleotide sequence differences in the >0.5% to <1% range. The percent nucleotide sequence differences were calculated and are shown in the panel to the right of each phylogeny as described in Figure 2.
Figure 4
Figure 4. HPV35 variant tree topologies and pairwise comparisons of individual complete genomes.
The phylogenetic tree was constructed as described in Figure 2. There were no distinct variant lineages however, sublineages (i.e., termed A1 and A2) were inferred from the tree topology and nucleotide sequence differences in the >0.5% to <1% range. The percent nucleotide sequence differences were calculated and are shown in the panel to the right of each phylogeny as described in Figure 2.
Figure 5
Figure 5. HPV52 variant tree topologies and pairwise comparisons of individual complete genomes.
The phylogenetic tree was constructed as described in Figure 2. Distinct variant lineages (i.e., termed A, B, C and D) are classified according to the topology and nucleotide sequence differences from >1% to <10%. Distinct sublineages (i.e., termed B1, B2, C1 and C2) were also inferred from the tree topology and nucleotide sequence differences in the >0.5% to <1% range. The percent nucleotide sequence differences were calculated and are shown in the panel to the right of each phylogeny as described in Figure 2.
Figure 6
Figure 6. HPV58 variant tree topologies and pairwise comparisons of individual complete genomes.
The phylogenetic tree was constructed as described in Figure 2. Distinct variant lineages (i.e., termed A, B, C and D) are classified according to the topology and nucleotide sequence differences from >1% to <10%. Distinct sublineages (i.e., termed A1, A2, A3, B1, B2, D1 and D2) were also inferred from the tree topology and nucleotide sequence differences in the >0.5% to <1% range. The percent nucleotide sequence differences were calculated and are shown in the panel to the right of each phylogeny as described in Figure 2.
Figure 7
Figure 7. HPV67 variant tree topologies and pairwise comparisons of individual complete genomes.
The phylogenetic tree was constructed as described in Figure 2. Distinct variant lineages (i.e., termed A and B) are classified according to the topology and nucleotide sequence differences from >1% to <10%. Distinct sublineages (i.e., termed A1 and A2) were also inferred from the tree topology and nucleotide sequence differences in the >0.5% to <1% range. The percent nucleotide sequence differences were calculated and are shown in the panel to the right of each phylogeny as described in Figure 2.
Figure 8
Figure 8. Diagnostic lineage-specific single nucleotide polymorphisms (SNPs) and their position in the genome.
Lineage-specific SNPs were determined from alignments of type specific variants using the program MacClade v4.08 . The position of variants across HPV lineage(s) and sublineage(s) are displayed to the right of the name of the clade from which the data was abstracted, as depicted in the phylogenetic trees in Figures 2– 7. The viral genome sequence differences for each sequenced isolate are displayed in Figure S2. Regions of the genome are displayed below the x-axis for reference. The graphic output was generated using Microsoft Excel.
Figure 9
Figure 9. Single-nucleotide polymorphism (SNP) rarefaction curves.
The program EstimateS v8.2.0 for Mac OS (downloaded from: http://viceroy.eeb.uconn.edu/EstimateS) was used to illustrate the curves. The Y-axis represents the total number of parsim-informative single nucleotide polymorphisms (SNPs) observed in at least 2 genomes of a specific type. Insertion and deletions are counted as one event equal to a single SNP. The X-axis shows the number of sequenced isolates. The curve generated for variants of each HPV type are displayed by different lines as indicated by the key to the right of the curves. For reference, the number of variable nucleotide positions for HPV31, HPV33, HPV35, HPV52, HPV58 and HPV67 genomes are 3.8%, 2.4%, 1.8%, 4.4%, 5.1% and 1.7%, respectively (see Table 1).

References

    1. Jemal A, Bray F Center MM, Ferlay J, Ward E, et al. Global cancer statistics. CA Cancer J Clin. 2011;61:69–90. - PubMed
    1. Ferlay J, Shin HR, Bray F, Forman D, Mathers C, et al. Estimates of worldwide burden of cancer in 2008: GLOBOCAN 2008. Int J Cancer. 2011;127:2893–2917. - PubMed
    1. Bernard HU, Burk RD, Chen Z, van Doorslaer K, Hausen H, et al. Classification of papillomaviruses (PVs) based on 189 PV types and proposal of taxonomic amendments. Virology. 2010;401:70–79. - PMC - PubMed
    1. de Villiers EM, Fauquet C, Broker TR, Bernard HU, zur Hausen H. Classification of papillomaviruses. Virology. 2004;324:17–27. - PubMed
    1. Munoz N, Bosch FX, de Sanjose S, Herrero R, Castellsague X, et al. Epidemiologic classification of human papillomavirus types associated with cervical cancer. N Engl J Med. 2003;348:518–527. - PubMed

Publication types