. 2011 Jan 12;17(2):183-203.
doi: 10.1080/13873954.2010.520409.

A dynamical model for describing behavioural interventions for weight loss and body composition change

Affiliations

A dynamical model for describing behavioural interventions for weight loss and body composition change

J-Emeterio Navarro-Barrientos et al. Math Comput Model Dyn Syst. .

Abstract

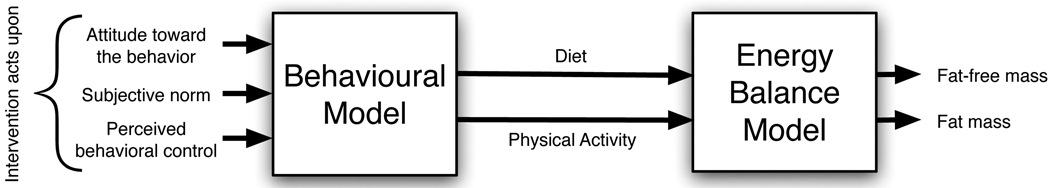
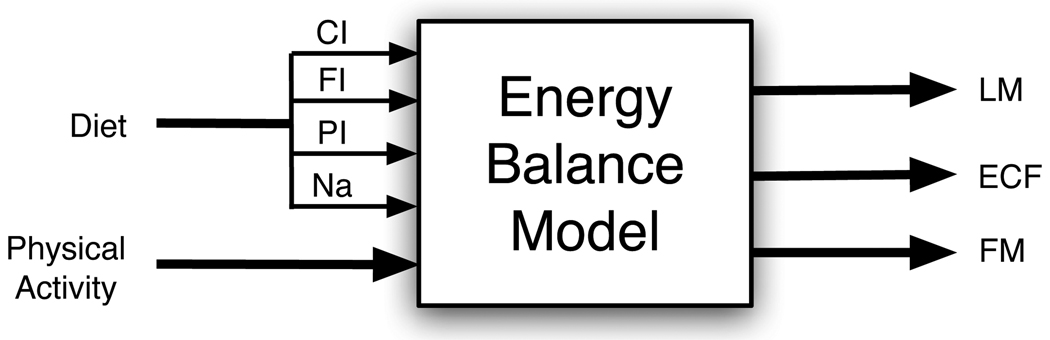
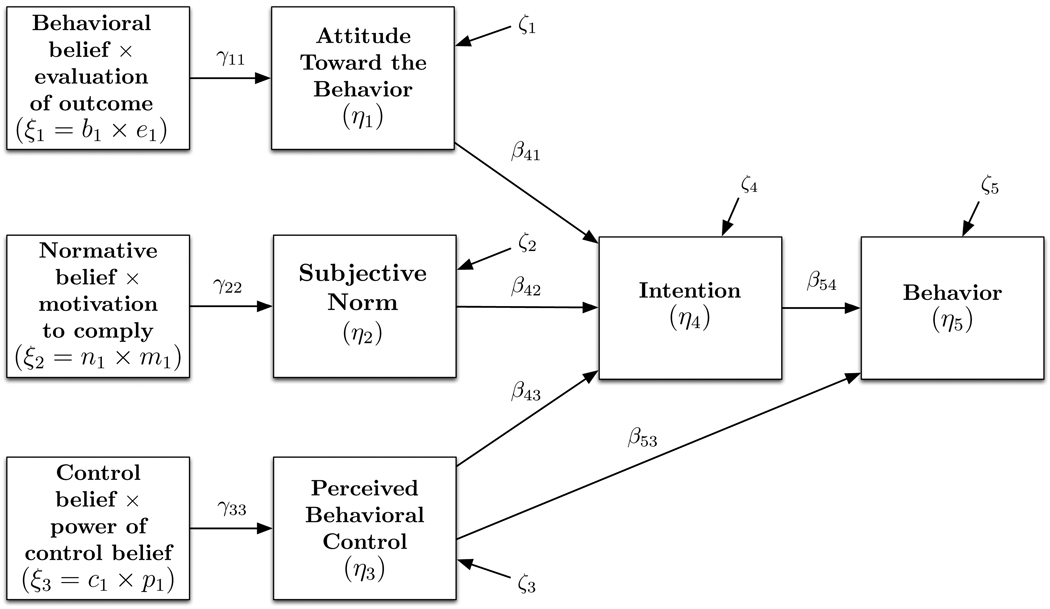
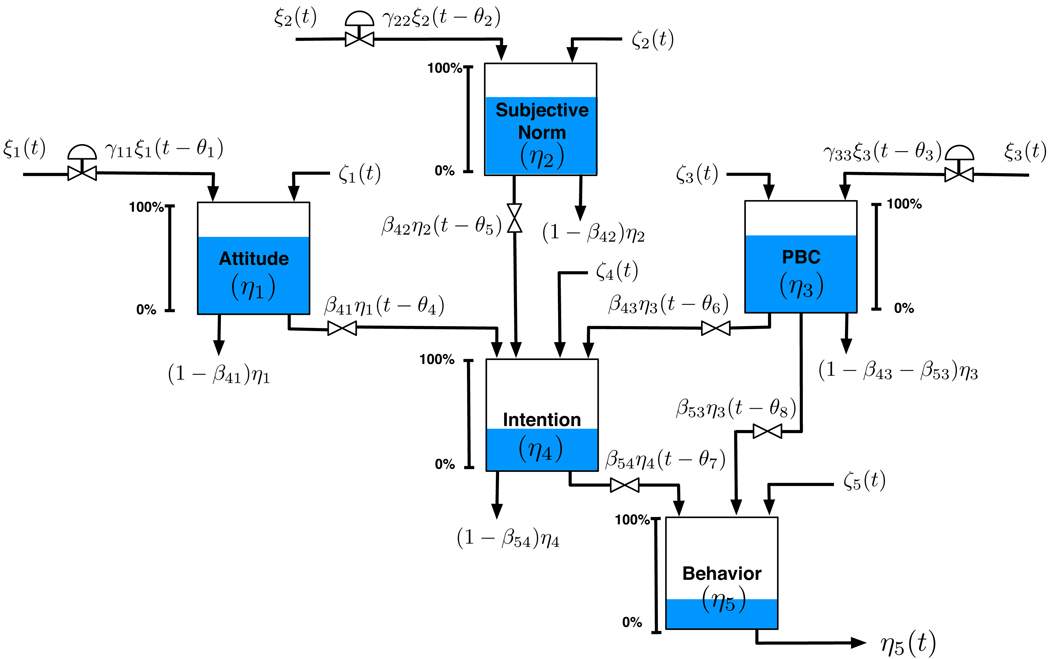
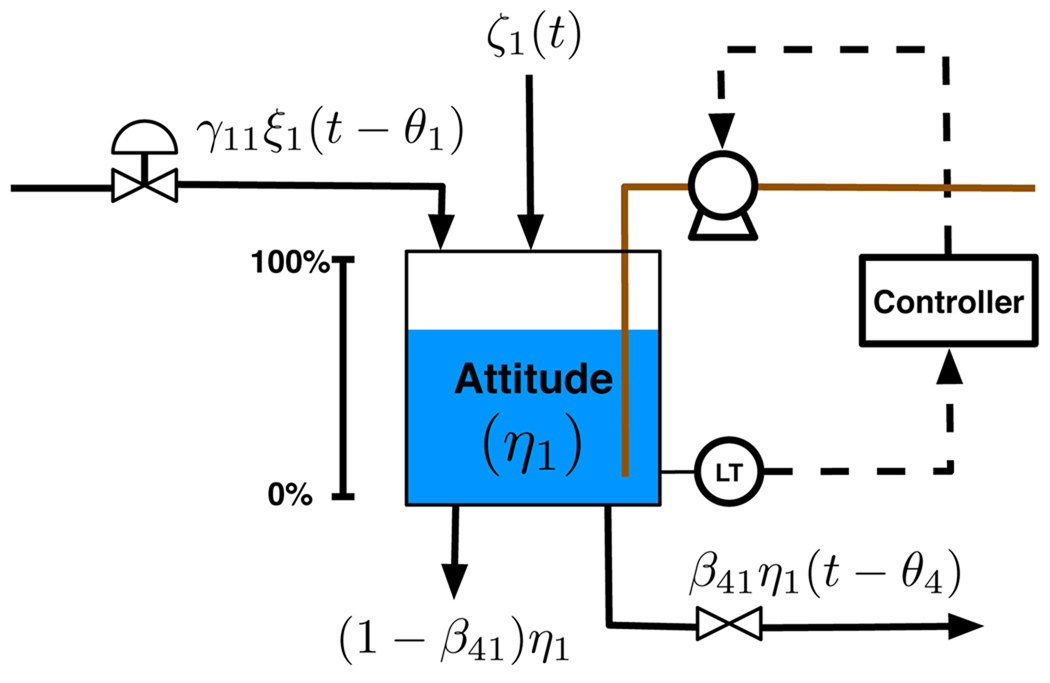
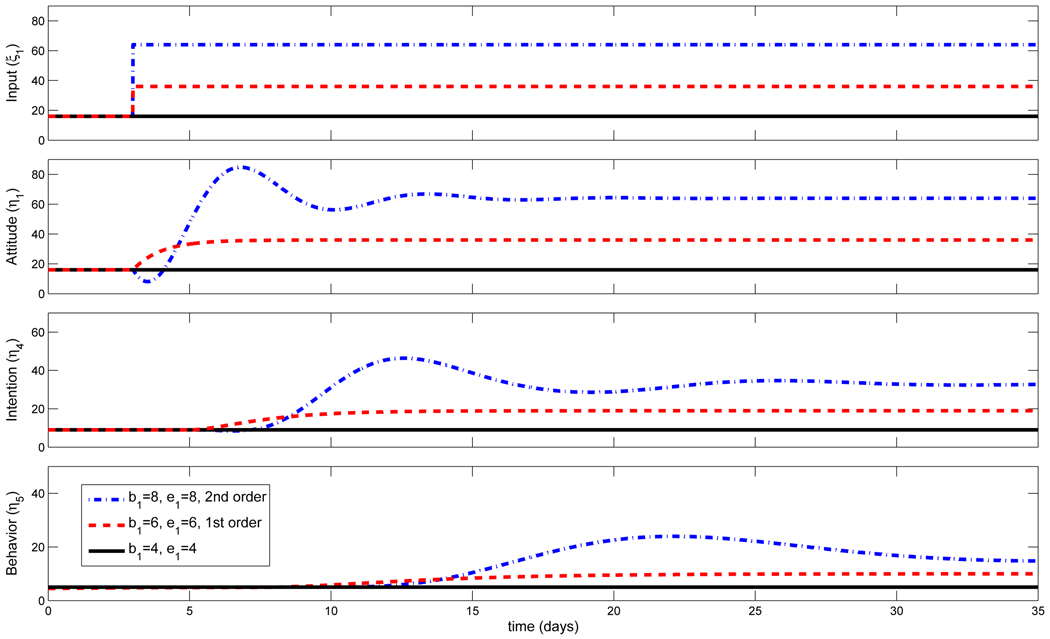
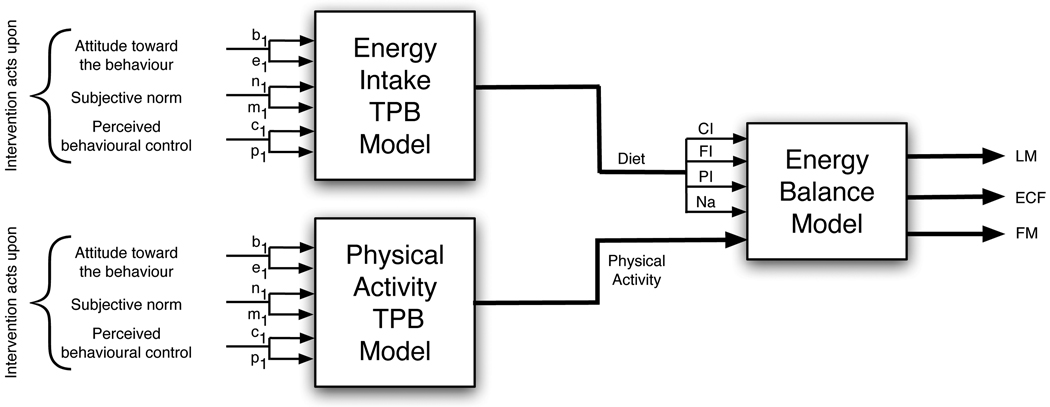
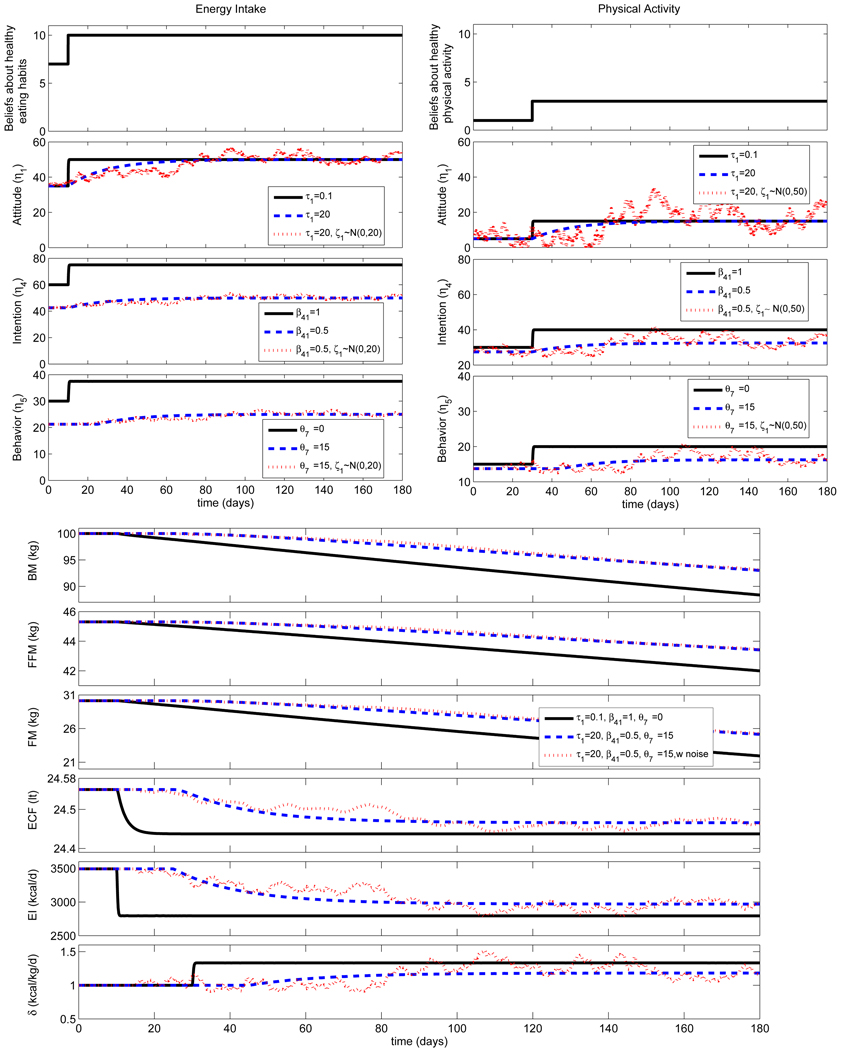
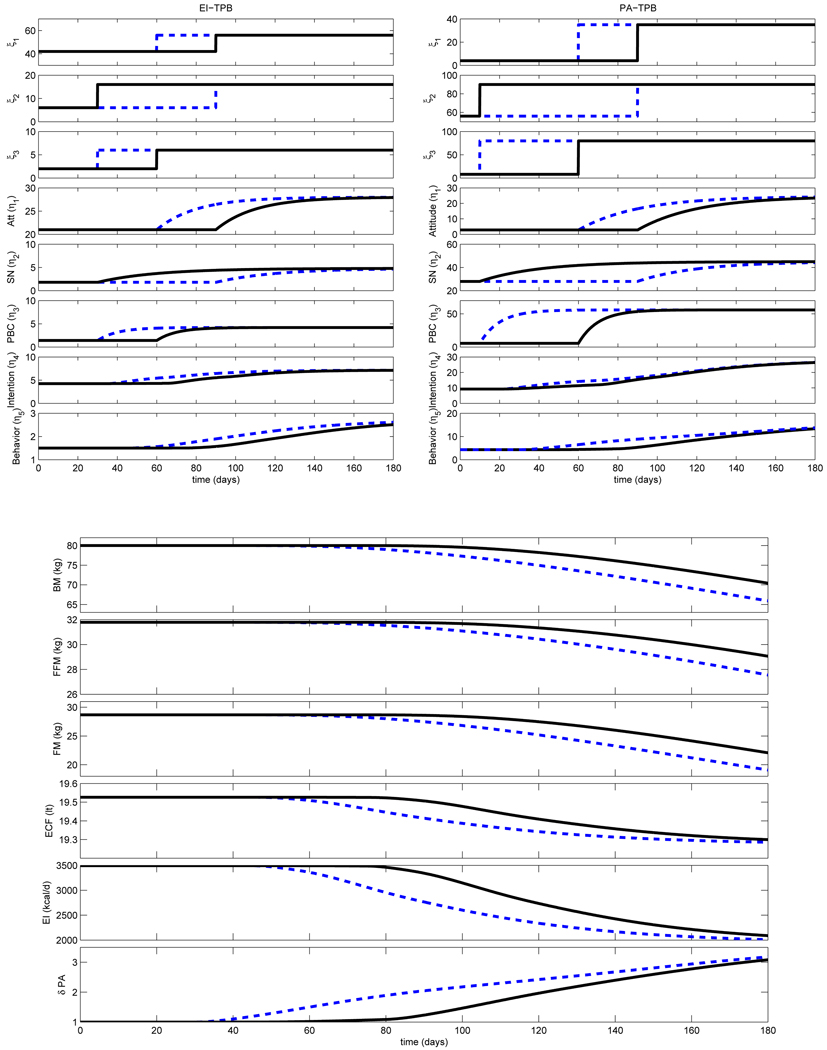
We present a dynamical model incorporating both physiological and psychological factors that predicts changes in body mass and composition during the course of a behavioral intervention for weight loss. The model consists of a three-compartment energy balance integrated with a mechanistic psychological model inspired by the Theory of Planned Behavior (TPB). The latter describes how important variables in a behavioural intervention can influence healthy eating habits and increased physical activity over time. The novelty of the approach lies in representing the behavioural intervention as a dynamical system, and the integration of the psychological and energy balance models. Two simulation scenarios are presented that illustrate how the model can improve the understanding of how changes in intervention components and participant differences affect outcomes. Consequently, the model can be used to inform behavioural scientists in the design of optimised interventions for weight loss and body composition change.


Figures

Figure 1
Figure 1
General diagram of the dynamical model for body mass and composition change.
Figure 2
Figure 2
Input-output block diagram representation for the three-compartment energy balance model. Primary inputs to the model consist of physical activity and diet. Diet in turn is comprised of carbohydrate intake (CI), fat intake (FI), protein intake (PI) and sodium intake (Na); the output compartments consist of lean mass (LM), fat mass (FM), and extracellular fluid (ECF).
Figure 3
Figure 3
Body mass BM and compartments (lean mass LM, fat mass FM, and extra-cellular fluid ECF) obtained from the three compartment model for the Minnesota semi-starvation experiment [19]. Body mass is compared to experimental data (★, with error bars) and the total body mass from the Westerterp et al. [10] two-compartment model (dashed line).
Figure 4
Figure 4
Path diagram for the Theory of Planned Behavior (TPB) with three exogenous variables ξi, five endogenous variables ηi, regression weights γij and βij and disturbances ζi.
Figure 5
Figure 5
Fluid analogy for the Theory of Planned Behavior (TPB) corresponding to the path diagram depicted in Figure 4. PBC stands for perceived behavioral control.
Figure 6
Figure 6
Fluid analogy for representing attitude in a dynamic TPB model using second-order derivatives.
Figure 7
Figure 7
Step response for the dynamic fluid analogy of the TPB for different ξ1 = b1 × e1 values, and contrasting first-order (red dashed line) versus second-order (dash-dotted blue line) responses. For the second order system, the damping coefficient is ς = 0.3 for all inventories. τa = −3 for the attitude inventory and τa = 0 for the other inventories. Additional parameters are ξ2 = ξ3 = 1, θ1 = ⋯ = θ3 = 0, θ4 = ⋯ = θ8 = 2, τ1 = τ2 = τ3 = 1, τ4 = 2, τ5 = 4, γij = 1, βij = 0.5 and ζi = 0.
Figure 8
Figure 8
The dynamical model for behavioural interventions integrates the energy balance model described in Section 2.2 and the dynamic fluid analogy for the TPB described in Section 3.2.
Figure 9
Figure 9
(top) Responses for the energy intake behaviour (EI-TPB) and physical activity behaviour (PA-TPB) models for interventions influencing beliefs about the outcome b1; (bottom) changes in body compartments and total effect of intervention on EI and PA. Simulations for the following intervention cases: (i) complete assimilation τ1 = 0.1, β41 = 1, θ7 = 0, (ii) partial assimilation τ1 = 20, β41 = 0.5, θ7 = 15, and (iii) partial assimilation as in case (ii) but with noise ζ1 ~ N(0, 20) (for EI), and ζ1 ~ N(0, 50) (for PA). Additional parameters: ξ2 = ξ3 = 50, θ1 = ⋯ = θ6 = 0, θ8 = 0, τ2 = ⋯ = τ5 = 0.1, γij = 1, β43 = β54 = 0.5 and β53 = 0.
Figure 10
Figure 10
(top) Responses for the energy intake behaviour (EI-TPB) and physical activity behaviour (PA-TPB) models for two intervention sequences; (bottom) changes in body compartments and total effect of the intervention on EI and PA. Simulations for the following intervention cases: intervention sequence A (solid), leading to a decrease on weight of 10 kg in 6 months, and intervention sequence B (dashed), leading to a weight loss of 15 kg during the same time period. Additional parameters are shown in Tables 2, 3 and 4

References

    1. Keim NL, Blanton CA, Kretsch MJ. America’s obesity epidemic: Measuring physical activity to promote an active lifestyle. Journal of the American Dietetic Association. 2004;vol. 104(no. 9):1398–1409. - PubMed
    1. Mokdad AH, Bowman BA, Ford ES, Vinicor F, Marks JS, Koplan JP. The Continuing Epidemics of Obesity and Diabetes in the United States. JAMA. 2001;vol. 286(no. 10):1195–1200. - PubMed
    1. W. H. Organization. tech. rep. WHO; 2008. [Accesed December 23, 2009]. Diet and physical activity: a public health priority.
    1. Baranowski T, Cullen K, Nicklas T, Thompson D, Baranowski J. Are current health behavioral change models helpful in guiding prevention of weight gain efforts? Obesity Research. 2003;vol. 11:23S–43S. - PubMed
    1. Hall K, Jordan P. Modeling weight-loss maintenance to help prevent body weight regain. Am J Clin Nutr. 2008;vol. 88:1495–1503. - PubMed

LinkOut - more resources