Neurobiologically realistic determinants of self-organized criticality in networks of spiking neurons
- PMID: 21673863
- PMCID: PMC3107249
- DOI: 10.1371/journal.pcbi.1002038
Neurobiologically realistic determinants of self-organized criticality in networks of spiking neurons
Abstract
Self-organized criticality refers to the spontaneous emergence of self-similar dynamics in complex systems poised between order and randomness. The presence of self-organized critical dynamics in the brain is theoretically appealing and is supported by recent neurophysiological studies. Despite this, the neurobiological determinants of these dynamics have not been previously sought. Here, we systematically examined the influence of such determinants in hierarchically modular networks of leaky integrate-and-fire neurons with spike-timing-dependent synaptic plasticity and axonal conduction delays. We characterized emergent dynamics in our networks by distributions of active neuronal ensemble modules (neuronal avalanches) and rigorously assessed these distributions for power-law scaling. We found that spike-timing-dependent synaptic plasticity enabled a rapid phase transition from random subcritical dynamics to ordered supercritical dynamics. Importantly, modular connectivity and low wiring cost broadened this transition, and enabled a regime indicative of self-organized criticality. The regime only occurred when modular connectivity, low wiring cost and synaptic plasticity were simultaneously present, and the regime was most evident when between-module connection density scaled as a power-law. The regime was robust to variations in other neurobiologically relevant parameters and favored systems with low external drive and strong internal interactions. Increases in system size and connectivity facilitated internal interactions, permitting reductions in external drive and facilitating convergence of postsynaptic-response magnitude and synaptic-plasticity learning rate parameter values towards neurobiologically realistic levels. We hence infer a novel association between self-organized critical neuronal dynamics and several neurobiologically realistic features of structural connectivity. The central role of these features in our model may reflect their importance for neuronal information processing.
Conflict of interest statement
The authors have declared that no competing interests exist.
Figures

 -neuron modules, organized into four hierarchical levels. Squares in the connectivity matrix outline the nesting of hierarchical level
  (small orange squares) inside hierarchical level
  (large yellow squares). In the present study we considered networks of
  hierarchical levels and
  neurons. (b) An illustration of the synaptic plasticity rule used in the study. (c) Weight frequency distributions for the STDP rule with soft bounds (used in most simulations). (d) Weight frequency distributions for the STDP rule with soft bounds and reduced learning rate (used in some simulations). (e) Weight frequency distributions for the STDP rule with hard bounds (used in some simulations). Error bars represent the standard deviation.
 were assigned a cost of
  , synapses in hierarchical level
  were assigned a cost of
  , etc. Approximate values of the network (c) clustering coefficient and (d) characteristic path length across a range of randomizations of each hierarchical topology. Color-coding is the same as in (a).
 intervals. Integer spike numbers were jittered by the addition of uniformly distributed random numbers between
  and
and  . (b) Correlation coefficients between numbers of neuron spikes and numbers of module spikes as a function of network randomization. Correlations were computed from five-minute spike rasters. Error bars represent the standard error of the mean from
  simulations.

 intervals. (b) Illustrative fluctuations in the number of module spikes (top) and in the mean within-module excitatory synaptic weights (bottom), recorded over a
  minute period from a single module. Module spikes were binned at
  second intervals, and synaptic weights were sampled at
  second intervals. (c) Cumulative probability distributions of avalanche sizes, avalanche durations and inter-avalanche intervals and (d) an illustrative module spike raster of dynamics emergent on nonhierarchical network topologies in Figure 4a, with frozen synaptic weights.
 threshold for power-law scaling. Error bars represent the standard error of the mean from
  simulations.
 ), exponential (
 ) and linear (
 ) density scaling functions. Gray and pink distributions correspond to random networks (concave distributions) and ordered networks (convex distributions). (c) Mean exponents of statistically significant power-law distributions of avalanche sizes (black) and durations (red), as a function of network randomization. Error bars represent the standard error of the mean from
  simulations.
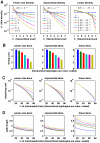
 ) density scaling function. Presumed network modules are shown in yellow, while inhibitory synapses are shown in red. Note the presence of significant numbers of intermodule inhibitory synapses. (b) A variant of the connectivity matrix in (a), with modularity of inhibitory neurons. (c) Statistical significance of power-law distributions of avalanche sizes (black) and durations (red) for the lattice (top), the lattice with restored module spike rate (center), and the modified lattice, in which inhibitory neurons were arranged into explicit modules. Gray lines show the
  threshold for power-law scaling. Error bars represent the standard error of the mean from
  simulations.
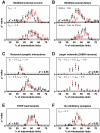
 ) density scaling function associated with (a) changes in external current (default
  ), (b) changes in conduction delays (default delays are uniformly distributed between
  and
and  ), (c) weaker postsynaptic response (default
  ) and slower STDP learning rate (default
  ) (d) doubling of module size to
  neurons and network size to
  neurons and reductions in postsynaptic response, STDP learning rate and external current (e) changes from soft to hard STDP weight bounds, and (f) removal of inhibitory synapses. Gray lines show the
  threshold for power-law scaling. Error bars represent the standard error of the mean from
  simulations.
References
-
- Plenz D, Thiagarajan TC. The organizing principles of neuronal avalanches: cell assemblies in the cortex? Trends Neurosci. 2007;30:101–110. - PubMed
-
- Beggs JM. The criticality hypothesis: how local cortical networks might optimize information processing. Philos Trans R Soc Lond A. 2008;366:329–343. - PubMed
-
- Bak P, Tang C, Wiesenfeld K. Self-organized criticality. Phys Rev A. 1988;38:364–374. - PubMed
-
- Jensen H. Self-Organized Criticality: Emergent Complex Behavior in Physical and Biological Systems (Cambridge Lecture Notes in Physics) Cambridge: Cambridge University Press; 1998.
Publication types
MeSH terms
LinkOut - more resources
Full Text Sources

